1. Equations & Inequalities
Linear Inequalities
Problem 27a
Textbook Question
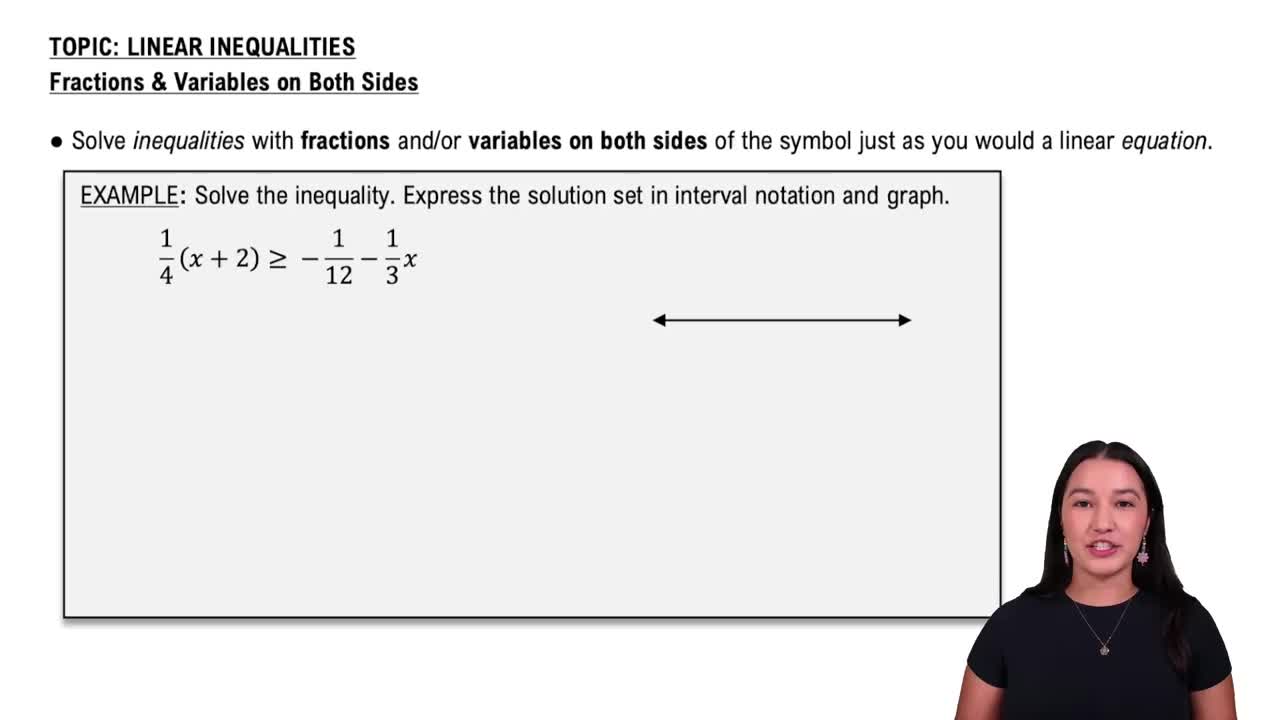
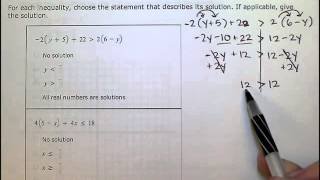
In all exercises, other than exercises with no solution, use interval notation to express solution sets and graph each solution set on a number line. In Exercises 27–50, solve each linear inequality. 5x + 11 < 26
 Verified step by step guidance
1
Start by isolating the variable term on one side of the inequality. Subtract 11 from both sides: \(5x + 11 - 11 < 26 - 11\).
Simplify the inequality: \(5x < 15\).
Divide both sides by 5 to solve for \(x\): \(x < \frac{15}{5}\).
Simplify the division: \(x < 3\).
Express the solution in interval notation: \((-\infty, 3)\) and graph this on a number line, shading all values less than 3 and using an open circle at 3.
Recommended similar problem, with video answer:
Verified SolutionThis video solution was recommended by our tutors as helpful for the problem above
Video duration:
2mWas this helpful?
Key Concepts
Here are the essential concepts you must grasp in order to answer the question correctly.
Linear Inequalities
A linear inequality is a mathematical statement that compares a linear expression to a value using inequality symbols such as <, >, ≤, or ≥. Unlike equations, linear inequalities represent a range of possible solutions rather than a single value. Understanding how to manipulate these inequalities is crucial for finding the solution set.
Recommended video:

 06:07
06:07Linear Inequalities
Interval Notation
Interval notation is a mathematical notation used to represent a range of values on the number line. It uses parentheses and brackets to indicate whether endpoints are included (closed interval) or excluded (open interval). For example, the interval (2, 5] includes all numbers greater than 2 and up to 5, including 5 itself.
Recommended video:
 05:18
05:18Interval Notation
Graphing on a Number Line
Graphing solution sets on a number line visually represents the range of values that satisfy an inequality. This involves marking points and using open or closed circles to indicate whether endpoints are included or excluded. This visual representation helps in understanding the solution set and its implications in real-world contexts.
Recommended video:
Guided course
 02:35
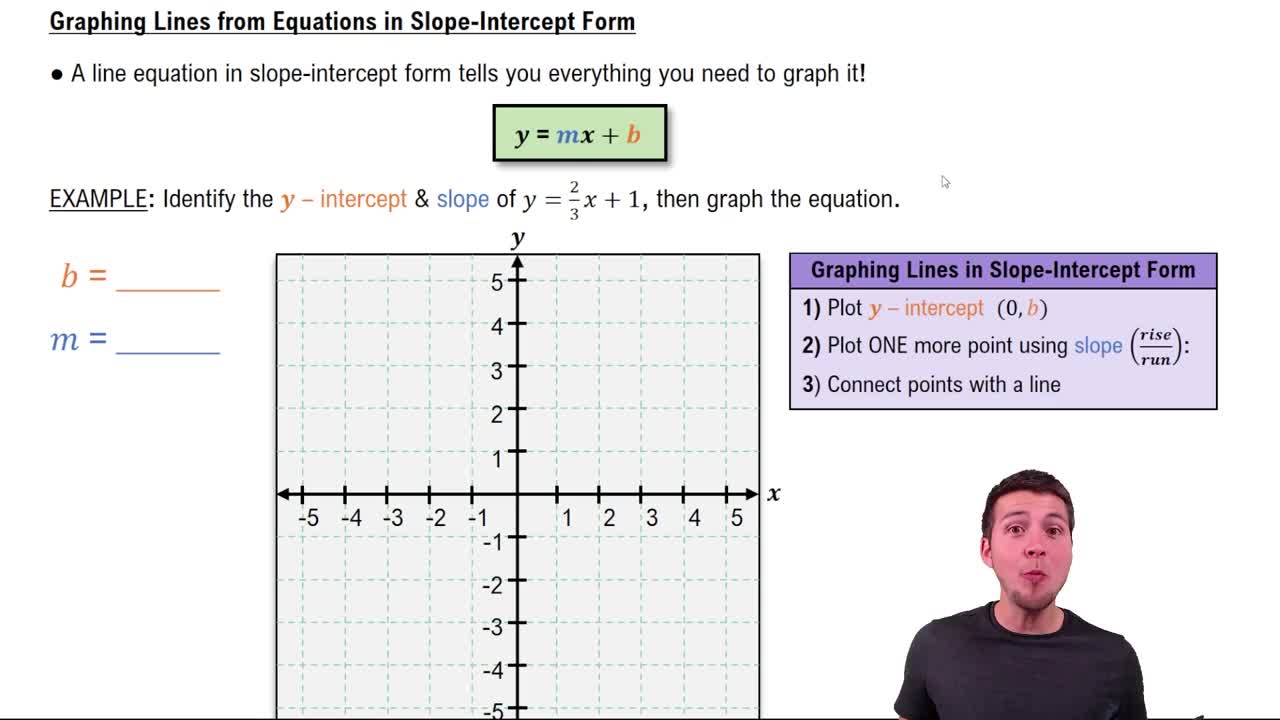
02:35Graphing Lines in Slope-Intercept Form

Related Videos
Related Practice