Here are the essential concepts you must grasp in order to answer the question correctly.
Graphing Functions
Graphing functions involves plotting points on a coordinate system where the x-axis represents the input values and the y-axis represents the output values. For the functions f(x) = x and g(x) = x + 3, you will calculate the corresponding y-values for selected x-values, which helps visualize the relationship between the two functions.
Recommended video:
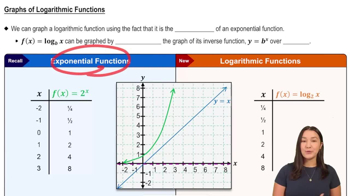
Graphs of Logarithmic Functions
Transformation of Functions
Transformation of functions refers to the changes made to the graph of a function based on modifications to its equation. In this case, g(x) = x + 3 represents a vertical shift of the graph of f(x) = x upwards by 3 units, illustrating how the output values of g are consistently 3 greater than those of f for the same input.
Recommended video:
Domain & Range of Transformed Functions
Coordinate System
A coordinate system is a two-dimensional plane defined by a horizontal axis (x-axis) and a vertical axis (y-axis). It allows for the representation of mathematical functions graphically. Understanding how to plot points and interpret the axes is crucial for analyzing the relationship between the graphs of f and g.
Recommended video:
Graphs & the Rectangular Coordinate System
 Verified step by step guidance
 Verified Solution


 5:2m
5:2m