Here are the essential concepts you must grasp in order to answer the question correctly.
Direct Variation
Direct variation describes a relationship between two variables where one variable is a constant multiple of the other. In the equation y = kx, 'k' represents the constant of variation, indicating how much y changes for a unit change in x. This relationship implies that as x increases, y also increases proportionally, and vice versa.
Recommended video:
Maximum Turning Points of a Polynomial Function
Graph of a Linear Function
The graph of a linear function, such as y = kx, is a straight line that passes through the origin (0,0) when k is positive. The slope of the line is equal to the constant 'k', which determines the steepness of the line. A higher value of k results in a steeper line, while a lower value leads to a gentler slope.
Recommended video:
Graphs of Logarithmic Functions
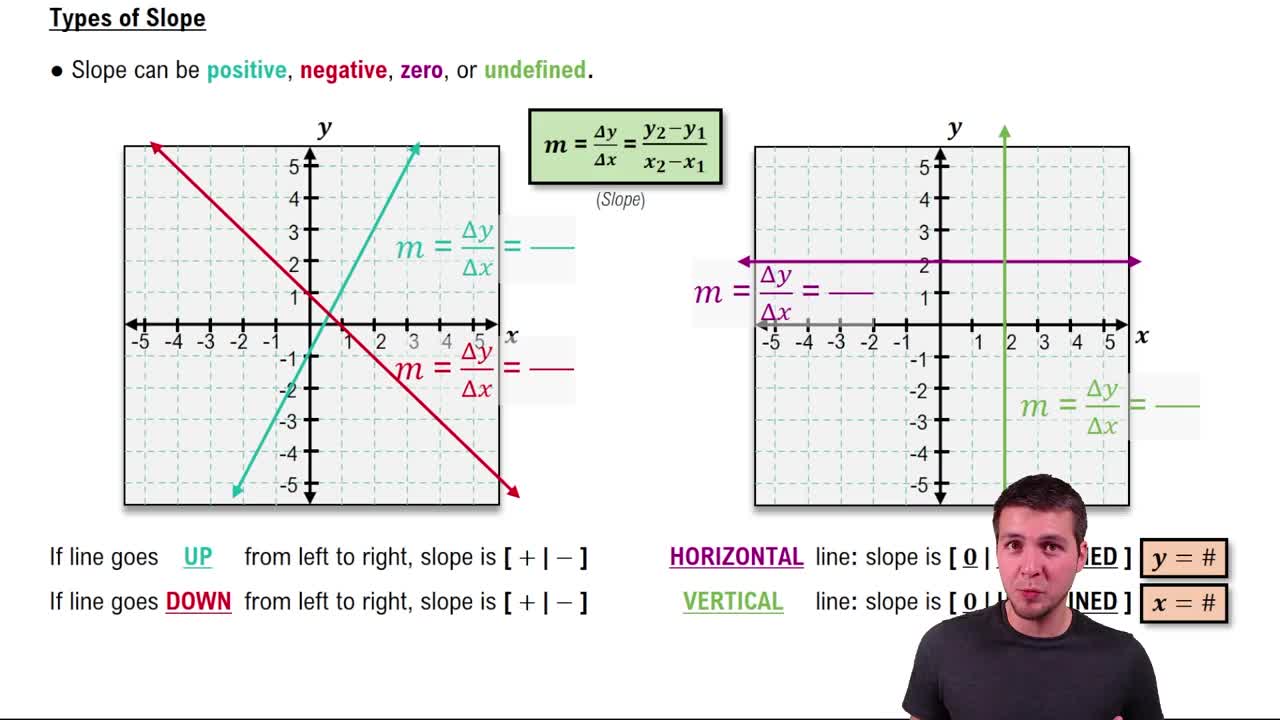
Positive Slope
A positive slope indicates that the line rises as it moves from left to right on a graph. In the context of the equation y = kx with k > 0, this means that for every increase in x, y also increases, reflecting a direct and positive relationship between the two variables. This characteristic is essential for identifying the correct graph that represents the direct variation.
Recommended video:
 Verified step by step guidance
 02:44
02:44