Here are the essential concepts you must grasp in order to answer the question correctly.
Graphing Functions
Graphing functions involves plotting points on a coordinate plane to visually represent the relationship between the input (x-values) and output (y-values) of a function. Understanding how to interpret the shape and behavior of different types of functions, such as linear, quadratic, or piecewise, is essential for accurately graphing them.
Recommended video:
Graphs of Logarithmic Functions
Domain and Range
The domain of a function refers to the set of all possible input values (x-values) that the function can accept, while the range is the set of all possible output values (y-values) that the function can produce. Identifying the domain and range is crucial for understanding the limitations and behavior of the function, especially in cases where certain values may lead to undefined outputs.
Recommended video:
Domain & Range of Transformed Functions
Greatest Integer Function
The greatest integer function, denoted as [[x]], returns the largest integer less than or equal to x. This function is also known as the floor function. Understanding how this function behaves is important for graphing it accurately, as it creates a step-like graph where each step corresponds to an integer value, affecting both the domain and range.
Recommended video:
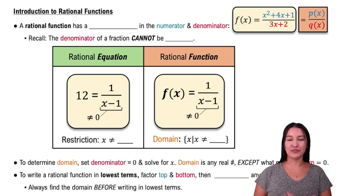
Intro to Rational Functions
 Verified step by step guidance
 5:26
5:26