1. Equations & Inequalities
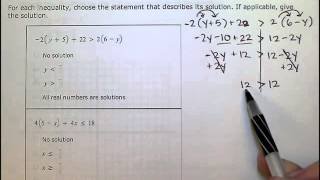
Linear Inequalities
Problem 35d
Textbook Question
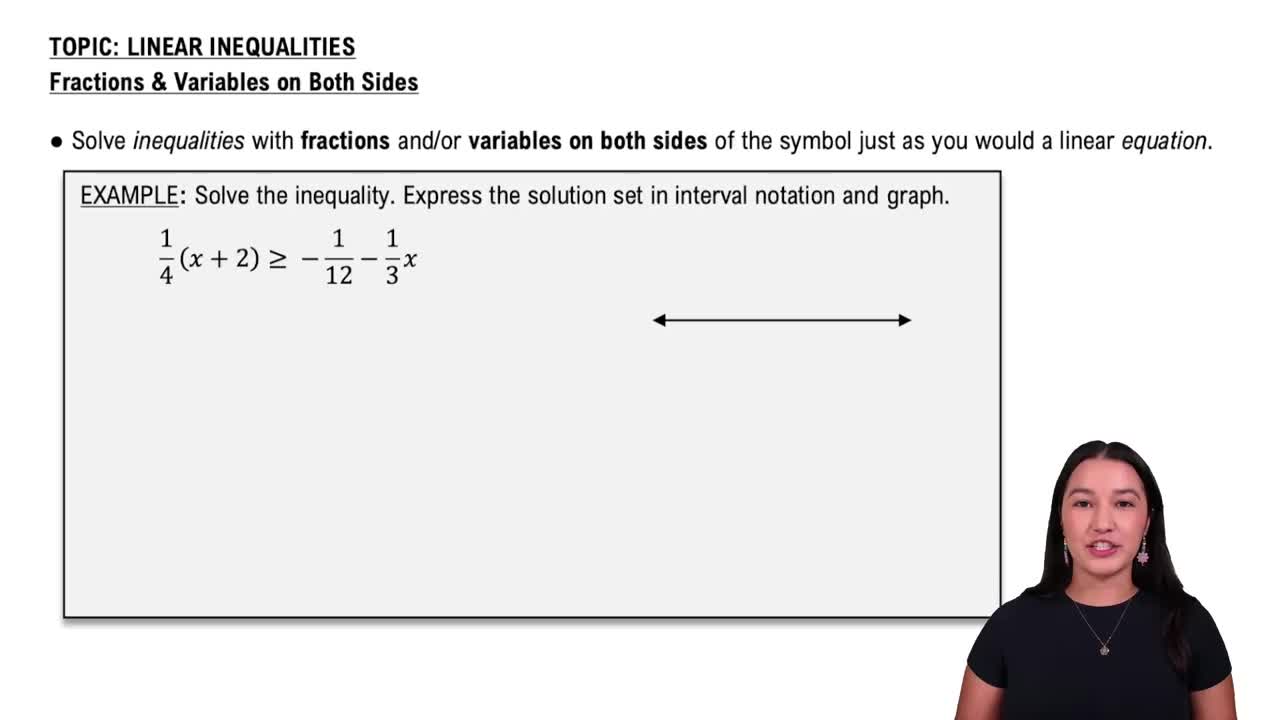
Solve each polynomial inequality in Exercises 1–42 and graph the solution set on a real number line. Express each solution set in interval notation. x^3+2x^2−x−2≥0
 Verified step by step guidance
1
<Step 1: Factor the polynomial.> Start by attempting to factor the polynomial \(x^3 + 2x^2 - x - 2\). You can use the method of grouping or synthetic division to find the factors.
<Step 2: Find the critical points.> Set the factored polynomial equal to zero to find the critical points. These are the values of \(x\) where the polynomial changes sign.
<Step 3: Test intervals.> Use the critical points to divide the number line into intervals. Choose a test point from each interval and substitute it into the original inequality \(x^3 + 2x^2 - x - 2 \geq 0\) to determine if the interval satisfies the inequality.
<Step 4: Determine the solution set.> Based on the test results, determine which intervals satisfy the inequality. Include the critical points in the solution set if the inequality is \(\geq\) or \(\leq\).
<Step 5: Express the solution in interval notation.> Write the solution set in interval notation, indicating the intervals where the inequality holds true.
Recommended similar problem, with video answer:
Verified SolutionThis video solution was recommended by our tutors as helpful for the problem above
Video duration:
8mWas this helpful?
Key Concepts
Here are the essential concepts you must grasp in order to answer the question correctly.
Polynomial Inequalities
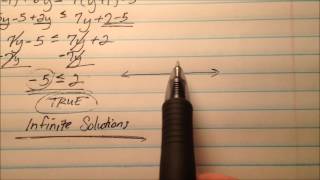
Polynomial inequalities involve expressions where a polynomial is compared to a value, typically zero, using inequality symbols such as ≥, ≤, >, or <. To solve these inequalities, one must find the values of the variable that make the inequality true, often by determining the roots of the polynomial and testing intervals between these roots.
Recommended video:

 06:07
06:07Linear Inequalities
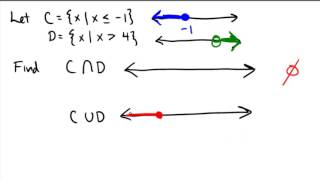
Interval Notation
Interval notation is a mathematical notation used to represent a range of values on the real number line. It uses parentheses and brackets to indicate whether endpoints are included (closed intervals) or excluded (open intervals). For example, the interval [a, b) includes 'a' but not 'b', while (a, b) excludes both endpoints.
Recommended video:
 05:18
05:18Interval Notation
Graphing Solution Sets
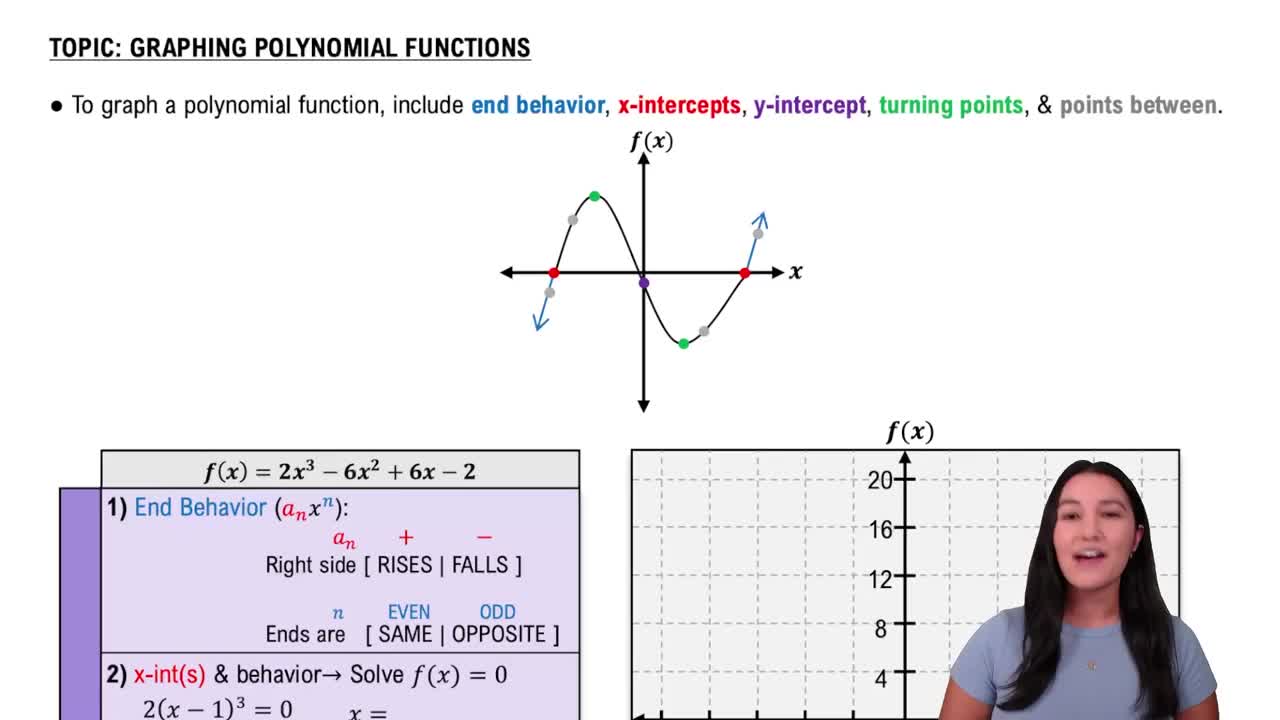
Graphing solution sets on a real number line visually represents the values that satisfy the inequality. This involves marking the roots of the polynomial and shading the appropriate regions based on the sign of the polynomial in each interval. This graphical representation helps in understanding the solution set and its relation to the inequality.
Recommended video:
 05:25
05:25Graphing Polynomial Functions

Related Videos
Related Practice