3. Functions
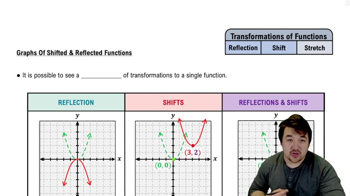
Transformations
Problem 7
Textbook Question
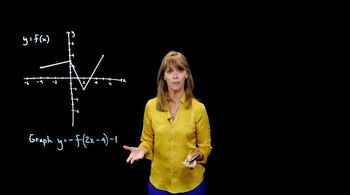
In Exercises 1-16, use the graph of y = f(x) to graph each function g. 
g(x) = f(-x)
 Verified step by step guidance
1
Identify the original function f(x) from the graph, which is a horizontal line segment from (1, -3) to (4, -3).
Understand that g(x) = f(-x) represents a reflection of f(x) across the y-axis.
Reflect each point of f(x) across the y-axis: the point (1, -3) becomes (-1, -3) and the point (4, -3) becomes (-4, -3).
Draw the new line segment for g(x) from (-4, -3) to (-1, -3) on the graph.
Verify that the new graph of g(x) is a horizontal line segment at y = -3, spanning from x = -4 to x = -1.
Recommended similar problem, with video answer:
Verified SolutionThis video solution was recommended by our tutors as helpful for the problem above
Video duration:
1mWas this helpful?
Key Concepts
Here are the essential concepts you must grasp in order to answer the question correctly.
Function Transformation
Function transformation refers to the changes made to the graph of a function based on modifications to its equation. In this case, g(x) = f(-x) represents a horizontal reflection of the function f(x) across the y-axis. Understanding how transformations affect the graph is crucial for accurately sketching the new function.
Recommended video:

 4:22
4:22Domain & Range of Transformed Functions
Graphing Functions
Graphing functions involves plotting points on a coordinate plane to visually represent the relationship between the input (x) and output (y) values. For the function g(x) = f(-x), one must identify the corresponding points from f(x) and reflect them across the y-axis to create the graph of g. This skill is essential for interpreting and analyzing functions.
Recommended video:
 5:26
5:26Graphs of Logarithmic Functions
Horizontal Reflection
A horizontal reflection occurs when a graph is flipped over the y-axis. This transformation changes the sign of the x-coordinates of all points on the graph. For example, if a point (a, b) exists on the graph of f(x), then the point (-a, b) will be on the graph of g(x) = f(-x). Recognizing this concept is vital for accurately graphing the transformed function.
Recommended video:
 5:00
5:00Reflections of Functions
 5:25m
5:25mWatch next
Master Intro to Transformations with a bite sized video explanation from Nick Kaneko
Start learningRelated Videos
Related Practice