Table of contents
- 0. Review of Algebra4h 16m
- 1. Equations & Inequalities3h 18m
- 2. Graphs of Equations43m
- 3. Functions2h 17m
- 4. Polynomial Functions1h 44m
- 5. Rational Functions1h 23m
- 6. Exponential & Logarithmic Functions2h 28m
- 7. Systems of Equations & Matrices4h 6m
- 8. Conic Sections2h 23m
- 9. Sequences, Series, & Induction1h 19m
- 10. Combinatorics & Probability1h 45m
3. Functions
Intro to Functions & Their Graphs
Problem 54b
Textbook Question
Graph each function. Give the domain and range. See Example 3. ƒ(x)=-[[x]]
 Verified step by step guidance
1
Step 1: Understand the function notation. The function \( f(x) = -[[x]] \) involves the greatest integer function, also known as the floor function, which is denoted by \( [[x]] \). This function returns the greatest integer less than or equal to \( x \).
Step 2: Analyze the effect of the negative sign. The function \( f(x) = -[[x]] \) means you take the greatest integer less than or equal to \( x \) and then multiply it by -1. This will reflect the values of the floor function across the x-axis.
Step 3: Determine the domain of the function. The domain of \( f(x) = -[[x]] \) is all real numbers, \( \mathbb{R} \), because the floor function is defined for every real number.
Step 4: Determine the range of the function. Since the floor function outputs integer values and the negative sign reflects these values, the range of \( f(x) = -[[x]] \) is all negative integers and zero, i.e., \( \{ 0, -1, -2, -3, \ldots \} \).
Step 5: Sketch the graph. To graph \( f(x) = -[[x]] \), plot points for various values of \( x \). For example, for \( x = 0.5 \), \( f(x) = -[[0.5]] = 0 \); for \( x = 1.5 \), \( f(x) = -[[1.5]] = -1 \). Connect these points with horizontal line segments, creating a step-like graph that decreases as \( x \) increases.
Recommended similar problem, with video answer:
 Verified Solution
This video solution was recommended by our tutors as helpful for the problem above
Video duration:
15mPlay a video:
Was this helpful?
Key Concepts
Here are the essential concepts you must grasp in order to answer the question correctly.
Graphing Functions
Graphing functions involves plotting points on a coordinate plane to visually represent the relationship between the input (x-values) and output (y-values) of a function. Understanding how to interpret the shape and behavior of different types of functions, such as linear, quadratic, or piecewise, is essential for accurately graphing them.
Recommended video:

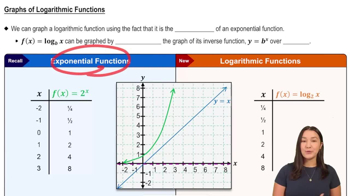
Graphs of Logarithmic Functions
Domain and Range
The domain of a function refers to the set of all possible input values (x-values) that the function can accept, while the range is the set of all possible output values (y-values) that the function can produce. Identifying the domain and range is crucial for understanding the limitations and behavior of the function being graphed.
Recommended video:

Domain & Range of Transformed Functions
Greatest Integer Function
The greatest integer function, denoted as [[x]], returns the largest integer less than or equal to x. This function is also known as the floor function. Understanding how this function behaves is important for graphing it accurately, as it creates a step-like graph with discontinuities at each integer value.
Recommended video:

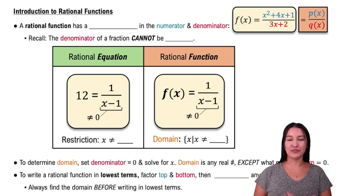
Intro to Rational Functions

 5:2m
5:2mWatch next
Master Relations and Functions with a bite sized video explanation from Nick Kaneko
Start learningRelated Videos
Related Practice


