Table of contents
- 0. Review of Algebra4h 16m
- 1. Equations & Inequalities3h 18m
- 2. Graphs of Equations43m
- 3. Functions2h 17m
- 4. Polynomial Functions1h 44m
- 5. Rational Functions1h 23m
- 6. Exponential & Logarithmic Functions2h 28m
- 7. Systems of Equations & Matrices4h 6m
- 8. Conic Sections2h 23m
- 9. Sequences, Series, & Induction1h 19m
- 10. Combinatorics & Probability1h 45m
3. Functions
Transformations
Problem 27
Textbook Question
Graph each function. See Examples 1 and 2. ƒ(x)=-3|x|
 Verified step by step guidance
1
Step 1: Understand the function. The function given is ƒ(x)=-3|x|. This is a transformation of the basic absolute value function, |x|. The -3 in front of the absolute value symbol means that the graph of the function will be vertically stretched by a factor of 3 and reflected over the x-axis.
Step 2: Identify key points. The basic absolute value function, |x|, has its vertex (the lowest point on the graph) at the origin, (0,0). Since the function is ƒ(x)=-3|x|, the vertex will still be at the origin. However, other points on the graph will be affected by the -3. For example, the point (1,1) on the graph of |x| will become (1,-3) on the graph of ƒ(x)=-3|x|.
Step 3: Draw the graph. Start by plotting the vertex at the origin. Then plot the point (1,-3) and its reflection across the y-axis, (-1,-3). Because the absolute value function produces a V-shaped graph, you can draw a straight line through these points to complete the graph.
Step 4: Check your graph. The graph should be a V shape that opens downward, with the vertex at the origin. The graph should pass through the points (1,-3) and (-1,-3).
Step 5: Label your graph. Make sure to label the x and y axes, as well as the vertex and a few other key points on the graph. This will help others understand your graph.
Recommended similar problem, with video answer:
 Verified Solution
This video solution was recommended by our tutors as helpful for the problem above
Video duration:
5mPlay a video:
Was this helpful?
Key Concepts
Here are the essential concepts you must grasp in order to answer the question correctly.
Absolute Value Function
The absolute value function, denoted as |x|, measures the distance of a number from zero on the number line, always yielding a non-negative result. For example, |3| equals 3, and |-3| also equals 3. This function is crucial for understanding how the graph of ƒ(x) = -3|x| behaves, as it reflects the input values across the x-axis.
Recommended video:

Function Composition
Transformation of Functions
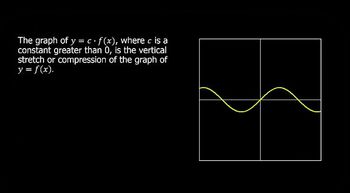
Transformations involve altering the basic shape of a function's graph through shifts, stretches, or reflections. In the case of ƒ(x) = -3|x|, the negative sign indicates a reflection over the x-axis, while the coefficient -3 indicates a vertical stretch by a factor of 3. Understanding these transformations helps in accurately sketching the graph.
Recommended video:

Domain & Range of Transformed Functions
Graphing Techniques
Graphing techniques involve plotting points and understanding the behavior of functions to create accurate visual representations. For ƒ(x) = -3|x|, one can start by plotting key points, such as (0,0), (1,-3), and (-1,-3), and then use the properties of the absolute value function to complete the graph. Mastery of these techniques is essential for effectively visualizing functions.
Recommended video:
Guided course

Graphs and Coordinates - Example

 5:25m
5:25mWatch next
Master Intro to Transformations with a bite sized video explanation from Nick Kaneko
Start learningRelated Videos
Related Practice


