7. Systems of Equations & Matrices
Graphing Systems of Inequalities
Problem 59b
Textbook Question
In Exercises 27–62, graph the solution set of each system of inequalities or indicate that the system has no solution. x≥0, y≥0, 2x+ 5y< 10, 3x + 4y ≤ 12 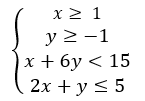
 Verified step by step guidance
1
Step 1: Graph the inequality x ≥ 1. This is a vertical line at x = 1, and you shade to the right of this line.
Step 2: Graph the inequality y ≥ -1. This is a horizontal line at y = -1, and you shade above this line.
Step 3: Graph the inequality x + 6y < 15. First, convert it to the equation x + 6y = 15. Find the intercepts by setting x and y to 0 respectively. Plot these points and draw the line, then shade below the line.
Step 4: Graph the inequality 2x + y ≤ 5. First, convert it to the equation 2x + y = 5. Find the intercepts by setting x and y to 0 respectively. Plot these points and draw the line, then shade below the line.
Step 5: Identify the region where all shaded areas overlap. This region is the solution set for the system of inequalities.
Recommended similar problem, with video answer:
Verified SolutionThis video solution was recommended by our tutors as helpful for the problem above
Video duration:
9mWas this helpful?
Key Concepts
Here are the essential concepts you must grasp in order to answer the question correctly.
Inequalities
Inequalities are mathematical expressions that show the relationship between two values when they are not equal. They can be strict (using < or >) or non-strict (using ≤ or ≥). Understanding how to interpret and graph inequalities is crucial for visualizing solution sets in a coordinate plane.
Recommended video:

 06:07
06:07Linear Inequalities
Graphing Systems of Inequalities
Graphing systems of inequalities involves plotting each inequality on a coordinate plane and identifying the region where all inequalities overlap. This region represents the solution set. The boundaries of the inequalities are often represented as solid lines (for ≤ or ≥) or dashed lines (for < or >) to indicate whether points on the line are included in the solution.
Recommended video:
Guided course
 6:19
6:19Systems of Inequalities
Feasibility of Solutions
The feasibility of solutions refers to whether a system of inequalities has at least one solution. If the regions defined by the inequalities do not overlap, the system has no solution. Analyzing the constraints imposed by each inequality helps determine if a feasible region exists.
Recommended video:
 06:00
06:00Categorizing Linear Equations
 7:2m
7:2mWatch next
Master Linear Inequalities with a bite sized video explanation from Patrick Ford
Start learning


