Graph each function. See Examples 1 and 2. ƒ(x)=-(1/2)x2
Verified step by step guidance
1
Identify the type of function given. The function ƒ(x) = -\(\frac{1}{2}\)x^2 is a quadratic function, which graphs as a parabola.
Note the coefficient of x^2, which is -\(\frac{1}{2}\). Since it is negative, the parabola opens downward, and the factor \(\frac{1}{2}\) affects the width, making it wider than the standard parabola y = -x^2.
Find the vertex of the parabola. For a function in the form ƒ(x) = ax^2 + bx + c, the vertex is at x = -\(\frac{b}{2a}\). Here, b = 0, so the vertex is at x = 0. Substitute x = 0 into the function to find the y-coordinate of the vertex.
Create a table of values by choosing x-values around the vertex (for example, x = -2, -1, 0, 1, 2), then calculate the corresponding y-values using the function ƒ(x) = -\(\frac{1}{2}\)x^2.
Plot the points from the table on the coordinate plane, mark the vertex, and draw a smooth curve through these points to complete the graph of the parabola.
Verified video answer for a similar problem:
This video solution was recommended by our tutors as helpful for the problem above
Video duration:
6m
Play a video:
0 Comments
Key Concepts
Here are the essential concepts you must grasp in order to answer the question correctly.
Quadratic Functions
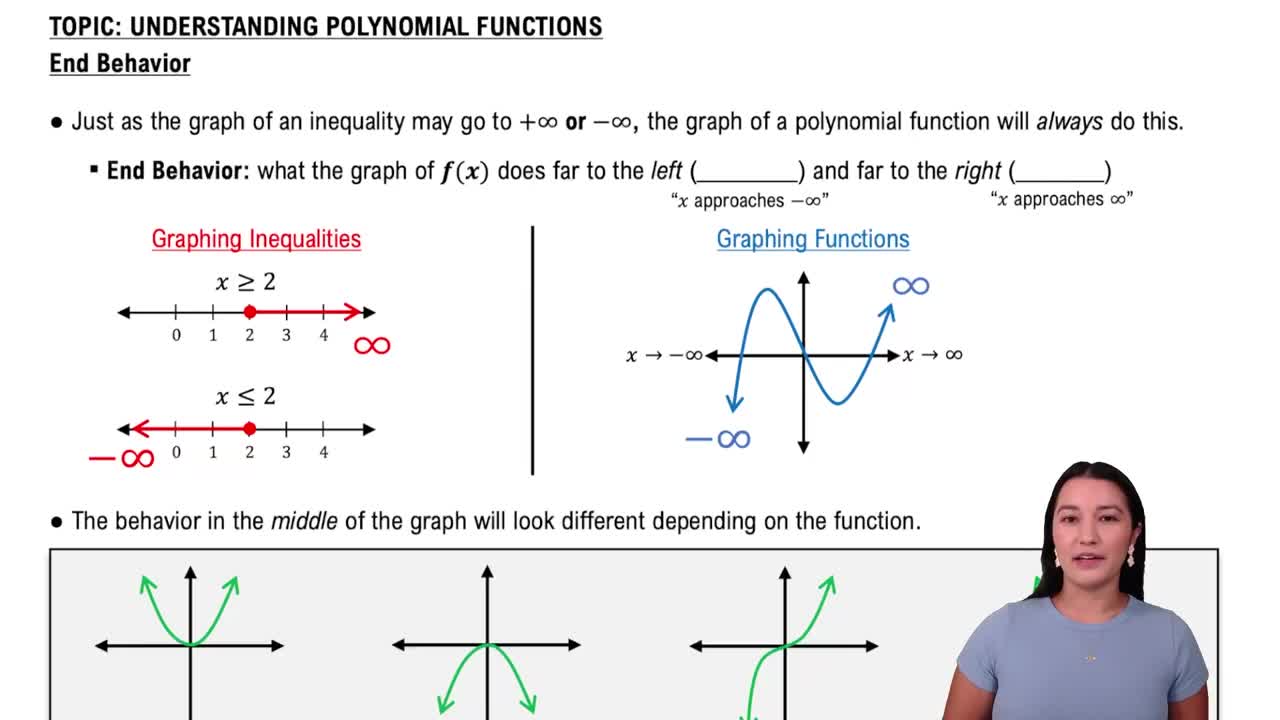
A quadratic function is a polynomial of degree two, typically written as f(x) = ax^2 + bx + c. Its graph is a parabola, which opens upward if a > 0 and downward if a < 0. Understanding the shape and properties of quadratic functions is essential for graphing them accurately.
Solving Quadratic Equations Using The Quadratic Formula
Effect of the Leading Coefficient
The leading coefficient (the number multiplying x^2) affects the parabola's direction and width. A negative coefficient, like -1/2, causes the parabola to open downward, while its absolute value determines how wide or narrow the parabola is compared to the standard y = x^2.
Graphing a quadratic involves plotting the vertex, axis of symmetry, and several points on either side. For f(x) = -(1/2)x^2, the vertex is at the origin (0,0), and symmetry about the y-axis helps in plotting points efficiently to sketch the parabola.

 Verified step by step guidance
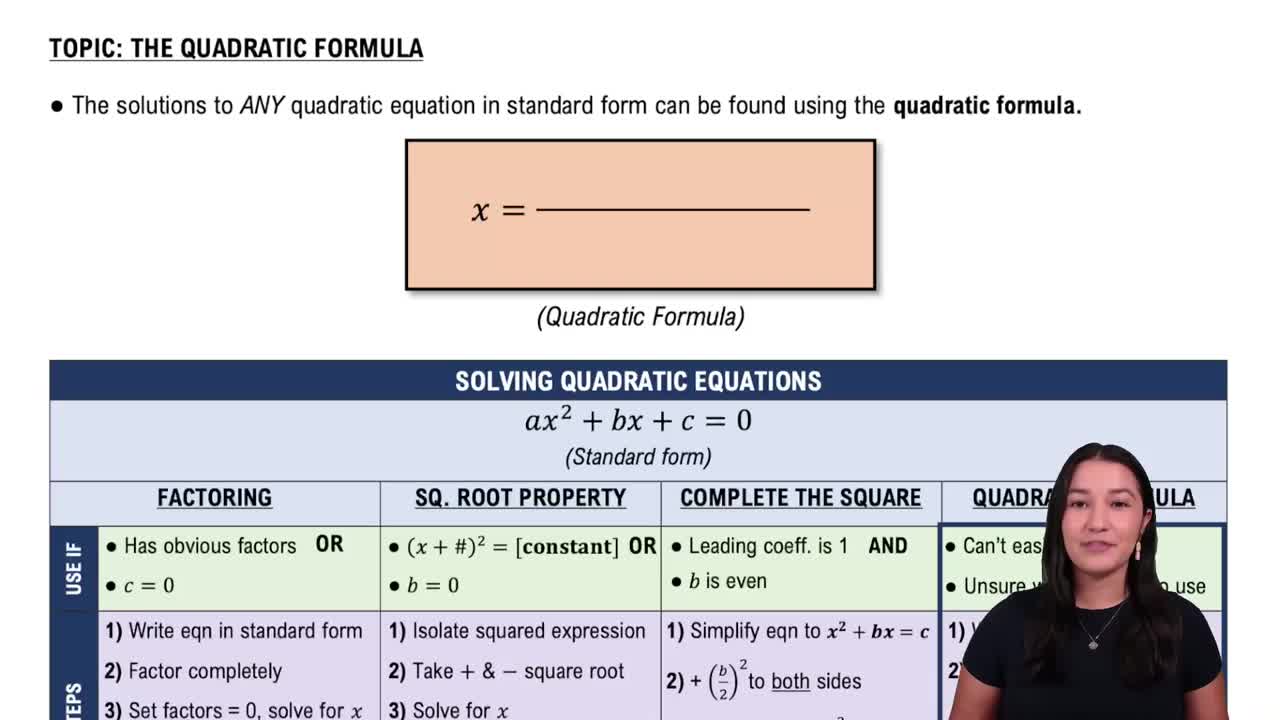
 06:36
06:36