Table of contents
- 0. Review of Algebra4h 16m
- 1. Equations & Inequalities3h 18m
- 2. Graphs of Equations43m
- 3. Functions2h 17m
- 4. Polynomial Functions1h 44m
- 5. Rational Functions1h 23m
- 6. Exponential & Logarithmic Functions2h 28m
- 7. Systems of Equations & Matrices4h 6m
- 8. Conic Sections2h 23m
- 9. Sequences, Series, & Induction1h 19m
- 10. Combinatorics & Probability1h 45m
7. Systems of Equations & Matrices
Graphing Systems of Inequalities
Problem 40
Textbook Question
In Exercises 39–45, graph each inequality. y ≤ (-1/2)x + 2
 Verified step by step guidance
1
<Step 1: Identify the inequality type. The inequality given is \( y \leq \frac{-1}{2}x + 2 \), which represents a linear inequality.>
<Step 2: Rewrite the inequality as an equation to find the boundary line. The boundary line is \( y = \frac{-1}{2}x + 2 \).>
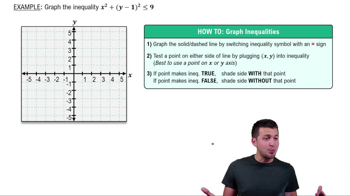
<Step 3: Graph the boundary line. Since the inequality is \( \leq \), use a solid line to indicate that points on the line are included in the solution set.>
<Step 4: Choose a test point not on the line to determine which side of the line to shade. A common test point is (0,0). Substitute into the inequality: \( 0 \leq \frac{-1}{2}(0) + 2 \).>
<Step 5: Shade the region that satisfies the inequality. If the test point satisfies the inequality, shade the region containing the test point; otherwise, shade the opposite side.>
Recommended similar problem, with video answer:
 Verified Solution
This video solution was recommended by our tutors as helpful for the problem above
Video duration:
4mPlay a video:
Was this helpful?
Key Concepts
Here are the essential concepts you must grasp in order to answer the question correctly.
Linear Inequalities
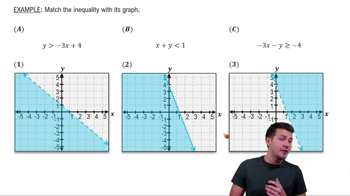
Linear inequalities are mathematical expressions that involve a linear function and an inequality sign (such as ≤, ≥, <, or >). They represent a range of values rather than a single solution, indicating that the values of the variable can be less than or equal to (or greater than or equal to) a certain expression. Understanding how to interpret and graph these inequalities is essential for visualizing the solution set.
Recommended video:

Linear Inequalities
Graphing Linear Equations
Graphing linear equations involves plotting points on a coordinate plane that satisfy the equation. The equation y = mx + b represents a line where 'm' is the slope and 'b' is the y-intercept. For the inequality y ≤ (-1/2)x + 2, one must first graph the line y = (-1/2)x + 2 as a dashed line (since the inequality is not strict) and then shade the region below the line to represent all the points that satisfy the inequality.
Recommended video:

Categorizing Linear Equations
Shading Regions in Graphs
Shading regions in graphs is a technique used to indicate the solution set of an inequality. For a linear inequality like y ≤ (-1/2)x + 2, the area below the line is shaded to show that all points in this region satisfy the inequality. This visual representation helps in understanding which values of x and y are included in the solution set, making it easier to analyze and interpret the results.
Recommended video:
Guided course

Graphs & the Rectangular Coordinate System

 7:2m
7:2mWatch next
Master Linear Inequalities with a bite sized video explanation from Patrick Ford
Start learning


