1. Equations & Inequalities
Linear Inequalities
Problem 6b
Textbook Question
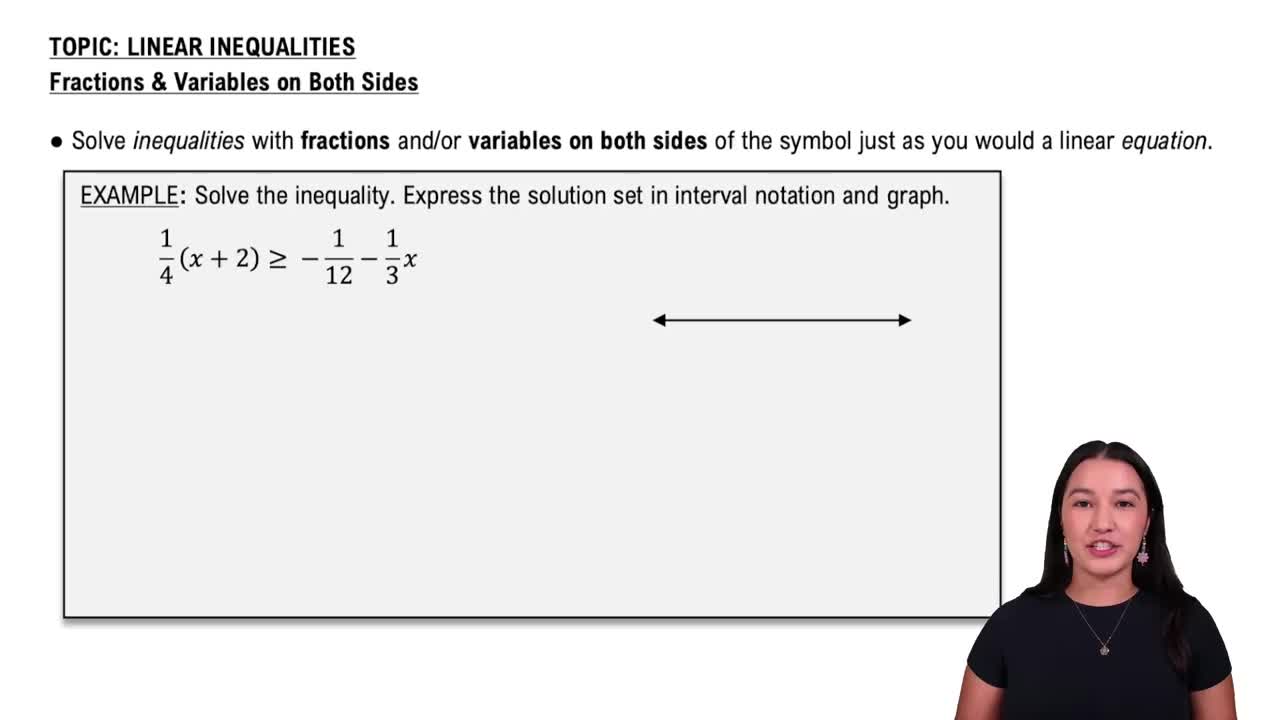
Match each equation or inequality in Column I with the graph of its solution set in Column II. | x | ≥ 7
 Verified step by step guidance
1
Step 1: Recognize that the given inequality is \(|x| \geq 7\), which involves an absolute value.
Step 2: Understand that \(|x| \geq 7\) means the distance of \(x\) from 0 on the number line is at least 7.
Step 3: Break down the absolute value inequality into two separate inequalities: \(x \geq 7\) or \(x \leq -7\).
Step 4: Consider the solution set on a number line. For \(x \geq 7\), shade the region to the right of 7, including 7. For \(x \leq -7\), shade the region to the left of -7, including -7.
Step 5: Match the graph that shows two rays: one starting at 7 and going to positive infinity, and another starting at -7 and going to negative infinity.
Recommended similar problem, with video answer:
Verified SolutionThis video solution was recommended by our tutors as helpful for the problem above
Video duration:
2mWas this helpful?
Key Concepts
Here are the essential concepts you must grasp in order to answer the question correctly.
Inequalities
Inequalities are mathematical expressions that show the relationship between two values when they are not equal. In this case, the inequality 'x ≥ 7' indicates that x can take any value greater than or equal to 7. Understanding how to interpret and graph inequalities is crucial for visualizing their solution sets.
Recommended video:

 06:07
06:07Linear Inequalities
Graphing Solutions
Graphing solutions involves representing the solution set of an equation or inequality on a number line or coordinate plane. For the inequality 'x ≥ 7', the graph would include a solid dot at 7 (indicating that 7 is included) and a line extending to the right, showing all values greater than 7. This visual representation helps in understanding the range of possible solutions.
Recommended video:
Guided course
 02:16
02:16Graphs and Coordinates - Example
Interval Notation
Interval notation is a way of writing subsets of the real number line. For the inequality 'x ≥ 7', the solution can be expressed in interval notation as [7, ∞), where the square bracket indicates that 7 is included in the set, and the parenthesis indicates that infinity is not a specific value but represents all numbers greater than 7. This notation is useful for succinctly conveying the range of solutions.
Recommended video:
 05:18
05:18Interval Notation

Related Videos
Related Practice