Here are the essential concepts you must grasp in order to answer the question correctly.
Inequalities
Inequalities are mathematical expressions that show the relationship between two values when they are not equal. They use symbols such as '>', '<', '≥', and '≤' to indicate whether one side is greater than, less than, or equal to the other. Understanding how to manipulate and graph inequalities is essential for visualizing solutions in a coordinate system.
Recommended video:
Graphing Linear Inequalities
Graphing linear inequalities involves representing the solutions of an inequality on a coordinate plane. This typically requires first converting the inequality into an equation to find the boundary line, which is then graphed. The area that satisfies the inequality is shaded, indicating all possible solutions, while the line itself is dashed for '>' or '<' and solid for '≥' or '≤'.
Recommended video:
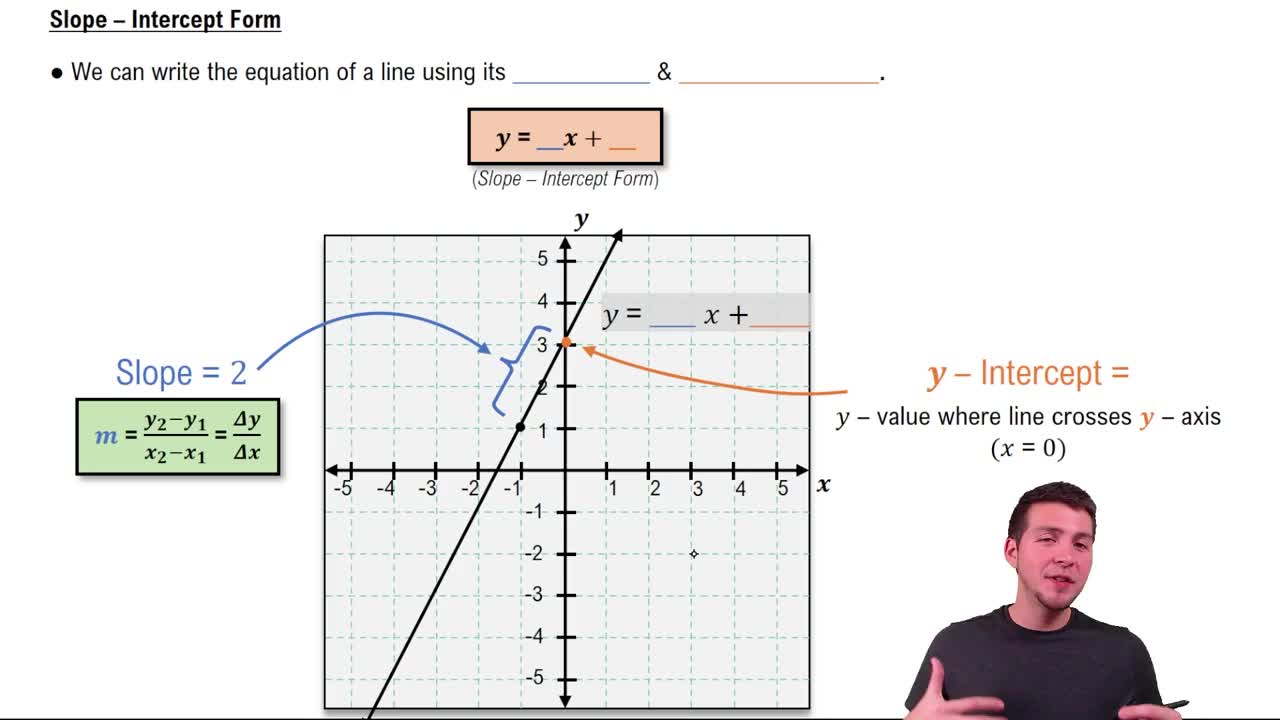
Slope-Intercept Form
The slope-intercept form of a linear equation is expressed as y = mx + b, where m represents the slope and b represents the y-intercept. This form is particularly useful for graphing linear inequalities, as it allows for easy identification of the line's slope and where it crosses the y-axis. Converting the given inequality into this form can simplify the graphing process.
Recommended video:
 Verified step by step guidance
 Verified Solution


 7:2m
7:2m