
Ch. 4 - Exponential and Logarithmic Functions
Blitzer - College Algebra 8th Edition
Blitzer8th EditionCollege AlgebraISBN: 9780136970514Not the one you use?Change textbook
Chapter 5, Problem 59

Graph y= 2x and x = 2y in the same rectangular coordinate system.

Verified step by step guidance
1
Identify the two functions to be graphed: the first is an exponential function \(y = 2^{x}\), and the second is \(x = 2^{y}\), which can be rewritten to express \(y\) in terms of \(x\) for easier graphing.
Rewrite the second equation \(x = 2^{y}\) by taking the logarithm base 2 of both sides to solve for \(y\): \(y = \log_{2}(x)\). This shows that the second graph is the logarithmic function, the inverse of the first.
Plot key points for \(y = 2^{x}\) by choosing several values of \(x\) (such as \(-2, -1, 0, 1, 2\)) and calculating the corresponding \(y\) values using \(y = 2^{x}\).
Plot key points for \(y = \log_{2}(x)\) by choosing several positive values of \(x\) (such as \(\frac{1}{4}, \frac{1}{2}, 1, 2, 4\)) and calculating the corresponding \(y\) values using \(y = \log_{2}(x)\).
Draw smooth curves through the plotted points for both functions on the same coordinate system, noting that the graphs are reflections of each other across the line \(y = x\) because they are inverse functions.

Verified video answer for a similar problem:

This video solution was recommended by our tutors as helpful for the problem above.
Video duration:
5m
Was this helpful?

Key Concepts

Here are the essential concepts you must grasp in order to answer the question correctly.

Exponential Functions

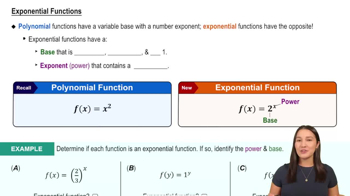
An exponential function has the form y = a^x, where the base a is a positive constant not equal to 1. It models rapid growth or decay, and its graph passes through (0,1) with a smooth curve increasing or decreasing depending on the base. Understanding y = 2^x helps in plotting one of the given functions.
Recommended video:
6:13
Exponential Functions

Inverse Functions and Their Graphs

The function x = 2^y can be seen as the inverse of y = 2^x by swapping variables. Inverse functions reflect across the line y = x, so graphing both on the same axes shows this symmetry. Recognizing this relationship aids in understanding the shape and position of both graphs.
Recommended video:
5:26
Graphs of Logarithmic Functions

Coordinate System and Plotting Points

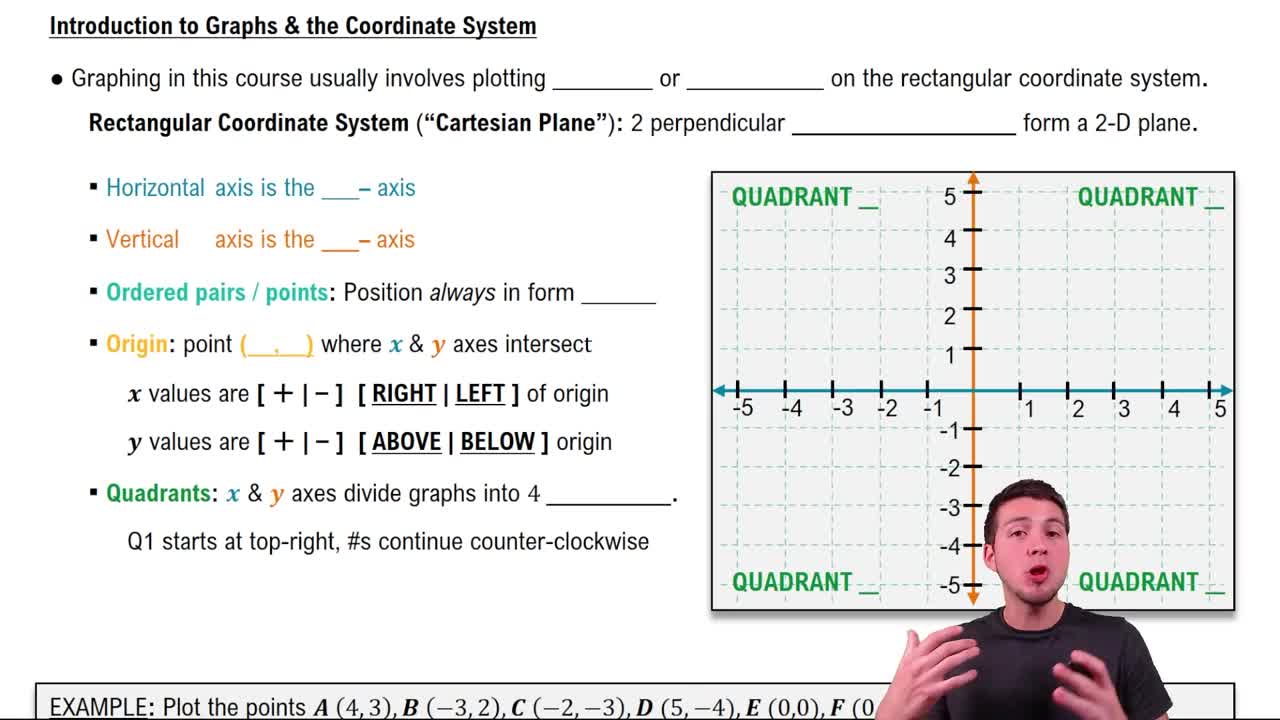
Plotting functions requires understanding the rectangular coordinate system, where each point is defined by (x, y). To graph y = 2^x and x = 2^y, select values for x or y, compute corresponding points, and plot them accurately. This visual representation helps compare and analyze the functions.
Recommended video:
Guided course
05:10
Graphs & the Rectangular Coordinate System