Graph f(x) = (1/2)^x and g(x) = log(1/2) x in the same rectangular coordinate system.
Verified step by step guidance
1
Step 1: Understand the functions. The function is an exponential function with a base of , which means it is a decreasing function. The function is a logarithmic function with the same base, , which also decreases as increases.
Step 2: Identify key points for . Calculate a few values: , , , and . These points will help in sketching the graph.
Step 3: Identify key points for . Calculate a few values: , , , and . These points will help in sketching the graph.
Step 4: Plot the points for both functions on the same coordinate system. For , plot the points (0,1), (1,0.5), (2,0.25), and (-1,2). For , plot the points (1,0), (0.5,1), (0.25,2), and (2,-1).
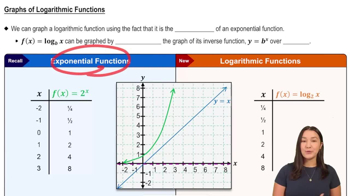
Step 5: Draw smooth curves through the points for each function. The graph of should show a decreasing exponential curve, while the graph of should show a decreasing logarithmic curve. Notice that the graphs are reflections of each other across the line .
Recommended similar problem, with video answer:
Verified Solution
This video solution was recommended by our tutors as helpful for the problem above
Video duration:
5m
Play a video:
Was this helpful?
Key Concepts
Here are the essential concepts you must grasp in order to answer the question correctly.
Exponential Functions
Exponential functions are mathematical expressions in the form f(x) = a^x, where 'a' is a positive constant. In this case, f(x) = (1/2)^x represents a decreasing exponential function, as the base (1/2) is less than 1. Understanding the behavior of exponential functions is crucial for graphing them, as they exhibit rapid growth or decay depending on the base.
Logarithmic functions are the inverses of exponential functions and are expressed as g(x) = log_b(x), where 'b' is the base. For g(x) = log(1/2)(x), the base is 1/2, indicating that this function will decrease as x increases. Recognizing the properties of logarithms, such as their domain and range, is essential for accurately graphing them alongside exponential functions.
Graphing in rectangular coordinate systems involves plotting points on a two-dimensional plane defined by an x-axis and a y-axis. Each function's graph is represented by a set of points (x, f(x)) or (x, g(x)). Understanding how to scale the axes and interpret the intersection points of different functions is vital for visualizing their relationships and behaviors in the same coordinate system.