3. Functions
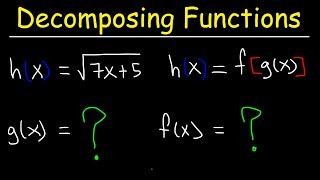
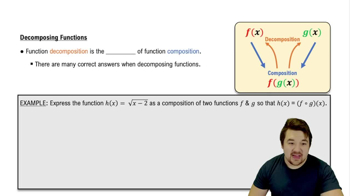
Function Composition
Problem 80
Textbook Question
Graph the inverse of each one-to-one function. 
 Verified step by step guidance
1
Identify the given function on the graph. The blue line represents the function.
Determine the equation of the given function. Since it is a straight line, it can be written in the form y = mx + b, where m is the slope and b is the y-intercept.
Find the slope (m) of the line by selecting two points on the line and using the formula m = (y2 - y1) / (x2 - x1).
Find the y-intercept (b) by identifying the point where the line crosses the y-axis.
To find the inverse function, swap the x and y variables in the equation of the original function and solve for y. This new equation represents the inverse function.
Verified video answer for a similar problem:This video solution was recommended by our tutors as helpful for the problem above
Video duration:
1mWas this helpful?
Key Concepts
Here are the essential concepts you must grasp in order to answer the question correctly.
One-to-One Functions
A one-to-one function is a type of function where each output value is uniquely paired with one input value. This means that no two different inputs produce the same output. This property is essential for a function to have an inverse, as the inverse must also be a function, which requires that each output corresponds to exactly one input.
Recommended video:
 4:07
4:07Decomposition of Functions
Inverse Functions
An inverse function essentially reverses the effect of the original function. If a function f takes an input x and produces an output y, then its inverse f⁻¹ takes y back to x. Graphically, the inverse of a function can be found by reflecting the graph of the original function across the line y = x, which helps visualize the relationship between the function and its inverse.
Recommended video:
 4:30
4:30Graphing Logarithmic Functions
Graphing Techniques
Graphing techniques involve plotting points on a coordinate plane to represent mathematical functions visually. For one-to-one functions and their inverses, understanding how to accurately reflect points across the line y = x is crucial. This reflection allows for the correct representation of the inverse function, ensuring that the graph maintains the one-to-one property.
Recommended video:
Guided course
 02:16
02:16Graphs and Coordinates - Example
 4:56m
4:56mWatch next
Master Function Composition with a bite sized video explanation from Nick Kaneko
Start learningRelated Videos
Related Practice