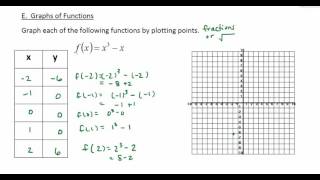
2. Graphs of Equations
Two-Variable Equations
Problem 77
Textbook Question
Textbook QuestionIn Exercises 77–92, use the graph to determine a.the x-intercepts, if any; b. the y-intercept, if any; and e. the missing function values, indicated by question marks, below each graph. 
 Verified Solution
This video solution was recommended by our tutors as helpful for the problem above
Video duration:
3mWas this helpful?
Key Concepts
Here are the essential concepts you must grasp in order to answer the question correctly.
X-Intercepts
X-intercepts are the points where a graph crosses the x-axis, meaning the output value (y) is zero. To find x-intercepts, set the function equal to zero and solve for x. In the provided graph, the x-intercepts are located at the points (-8, 0) and (10, 0).
Recommended video:
Guided course

 04:08
04:08Graphing Intercepts
Y-Intercepts
The y-intercept is the point where a graph crosses the y-axis, indicating the value of the function when x is zero. To determine the y-intercept, evaluate the function at x = 0. In the graph, the y-intercept is at the point (0, 8), showing that the function's value is 8 when x is zero.
Recommended video:
Guided course
04:08Graphing Intercepts
Function Values
Function values represent the output of a function for given input values. In the context of the graph, missing function values can be identified by observing the graph's behavior at specific x-values. For instance, the graph indicates a missing value at (0, -10), which suggests that the function's value at x = 0 is -10, indicating a point below the x-axis.
Recommended video:
 4:56
4:56Function Composition
 5:28m
5:28mWatch next
Master Equations with Two Variables with a bite sized video explanation from Patrick Ford
Start learningRelated Videos
Related Practice