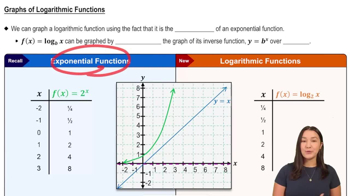
Here are the essential concepts you must grasp in order to answer the question correctly.
Graphing Functions
Graphing functions involves plotting points on a coordinate plane to visualize the relationship between the input (x-values) and output (y-values) of a function. Understanding how to interpret the shape of the graph helps in identifying key features such as intercepts, asymptotes, and overall behavior as x approaches positive or negative infinity.
Recommended video:
Graphs of Logarithmic Functions
Domain and Range
The domain of a function refers to all possible input values (x-values) that can be used without causing any mathematical inconsistencies, such as division by zero or taking the square root of a negative number. The range, on the other hand, consists of all possible output values (y-values) that the function can produce based on its domain, providing insight into the function's behavior.
Recommended video:
Domain & Range of Transformed Functions
Exponential Functions
Exponential functions are mathematical expressions in which a constant base is raised to a variable exponent. In the given function, ƒ(x) = -(1/3)^(x-2) + 2, the base is (1/3), which indicates that the function will decrease as x increases. Understanding the characteristics of exponential functions, including their growth or decay, is essential for accurately graphing and analyzing them.
Recommended video:
 Verified step by step guidance
 Verified Solution

