Graph each function. Give the domain and range. ƒ(x) = (1/3)x-2 + 2
Verified step by step guidance
1
Identify the base function and transformations: The base function here is an exponential function of the form \(f(x) = a \cdot b^{x}\), where \(b = \frac{1}{3}\). The given function is \(f(x) = -\left(\frac{1}{3}\right)^{x-2} + 2\). Notice the transformations applied to the base function.
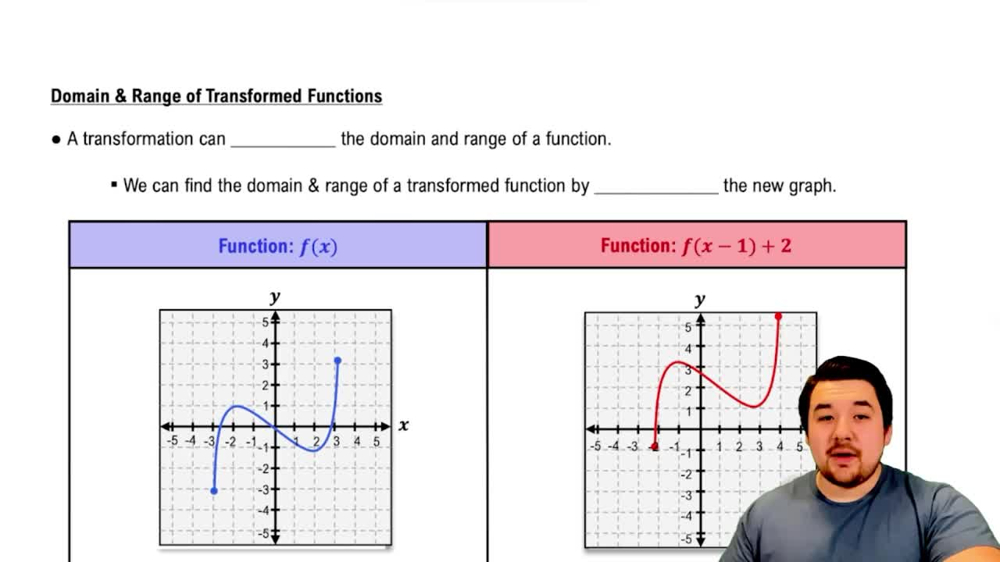
Analyze the horizontal shift: The expression \(x - 2\) inside the exponent indicates a horizontal shift to the right by 2 units. This means the graph of \(\left(\frac{1}{3}\right)^x\) is shifted 2 units to the right.
Consider the reflection and vertical shift: The negative sign in front of the exponential, \(-\left(\frac{1}{3}\right)^{x-2}\), reflects the graph across the x-axis. Then, adding 2 shifts the entire graph up by 2 units.
Determine the domain: Since exponential functions are defined for all real numbers, the domain of \(f(x)\) is all real numbers, which can be written as \((-\infty, \infty)\).
Find the range: The base function \(\left(\frac{1}{3}\right)^{x-2}\) is always positive. After reflection, it becomes negative, so the values are less than or equal to 0 before the vertical shift. Adding 2 shifts the range up, so the range is all real numbers less than 2, or \((-\infty, 2)\).
Verified video answer for a similar problem:
This video solution was recommended by our tutors as helpful for the problem above
Video duration:
9m
Play a video:
0 Comments
Key Concepts
Here are the essential concepts you must grasp in order to answer the question correctly.
Exponential Functions
An exponential function has the form f(x) = a^x, where the variable is in the exponent. In this question, the base is 1/3, which is between 0 and 1, indicating exponential decay. Understanding how the function behaves as x increases or decreases is essential for graphing.
Transformations include shifts, reflections, and stretches/compressions of the graph. Here, the function is shifted horizontally by 2 units (x-2), reflected vertically (negative sign), and shifted vertically by +2. Recognizing these changes helps in accurately sketching the graph.
The domain is the set of all possible input values (x), and the range is the set of all possible output values (f(x)). For exponential functions, the domain is usually all real numbers, but the range depends on transformations. Identifying these sets is crucial for fully describing the function.

 Verified step by step guidance
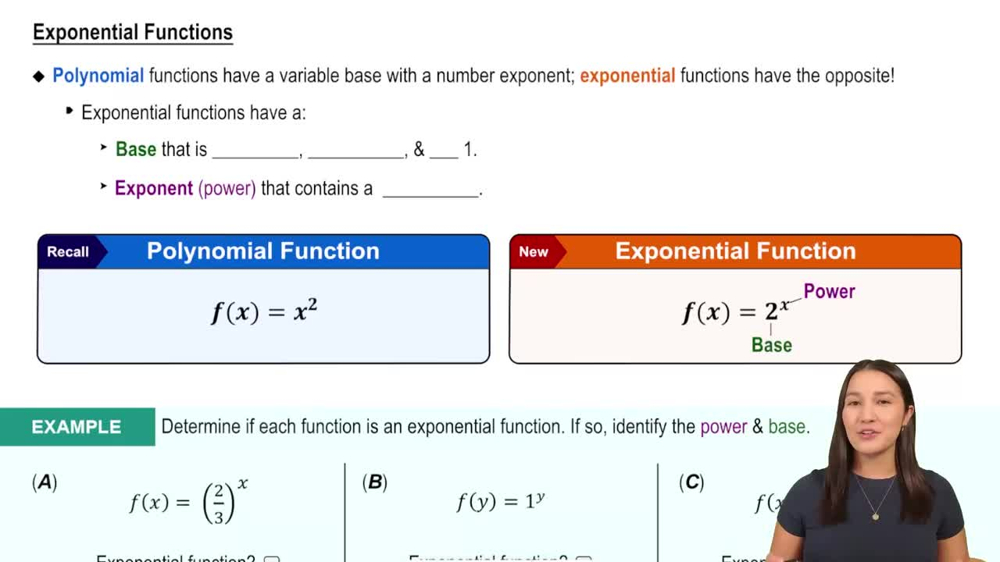
 6:13
6:13