3. Functions
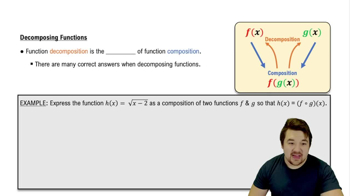
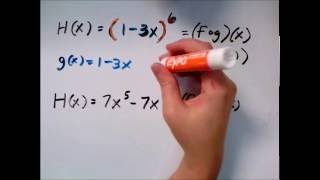
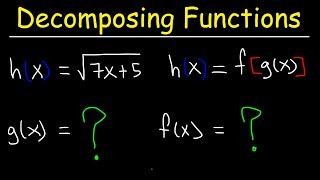
Function Composition
Problem 35d
Textbook Question
Use a graphing calculator to graph each equation in the standard viewing window. y = 3x + 4
 Verified step by step guidance
1
Identify the equation of the line: \( y = 3x + 4 \). This is in the slope-intercept form \( y = mx + b \), where \( m \) is the slope and \( b \) is the y-intercept.
Determine the slope \( m \) and y-intercept \( b \) from the equation. Here, \( m = 3 \) and \( b = 4 \).
Plot the y-intercept on the graph. Since \( b = 4 \), place a point at \( (0, 4) \) on the y-axis.
Use the slope \( m = 3 \) to find another point. The slope \( 3 \) means rise over run is \( \frac{3}{1} \). From the y-intercept \( (0, 4) \), move up 3 units and 1 unit to the right to plot the next point.
Draw a straight line through the points \( (0, 4) \) and the new point. This line represents the graph of the equation \( y = 3x + 4 \).
Recommended similar problem, with video answer:
Verified SolutionThis video solution was recommended by our tutors as helpful for the problem above
Video duration:
1mWas this helpful?
Key Concepts
Here are the essential concepts you must grasp in order to answer the question correctly.
Linear Equations
A linear equation is an algebraic expression that represents a straight line when graphed on a coordinate plane. It is typically written in the form y = mx + b, where m is the slope and b is the y-intercept. In the equation y = 3x + 4, the slope is 3, indicating the line rises three units for every one unit it moves to the right, while the y-intercept is 4, meaning the line crosses the y-axis at (0, 4).
Recommended video:

 06:00
06:00Categorizing Linear Equations
Graphing Calculators
A graphing calculator is a powerful tool that allows users to visualize mathematical functions and equations. It can plot graphs, perform calculations, and analyze data. To graph the equation y = 3x + 4, one would input the equation into the calculator, which will then display the corresponding line on the graph, helping to understand the relationship between x and y values.
Recommended video:
 6:16
6:16Transformations of Exponential Graphs
Standard Viewing Window
The standard viewing window on a graphing calculator typically displays the range of x-values from -10 to 10 and y-values from -10 to 10. This window is useful for visualizing most linear equations, as it provides a balanced view of the graph. Adjusting the viewing window can help in analyzing specific features of the graph, such as intercepts and slopes, ensuring that the entire line is visible.
Recommended video:
Guided course
 05:16
05:16Standard Form of Polynomials
 4:56m
4:56mWatch next
Master Function Composition with a bite sized video explanation from Nick Kaneko
Start learningRelated Videos
Related Practice