Ch. 2 - Functions and Graphs
Blitzer - College Algebra 8th Edition
Blitzer8th EditionCollege AlgebraISBN: 9780136970514Not the one you use?Change textbook
Chapter 3, Problem 79

In Exercises 77–92, use the graph to determine a. the function's domain; b. the function's range; and e. the missing function values, indicated by question marks, below each graph.
Graph of a quadratic function with points (0,0) and (0,1) marked.

Verified step by step guidance
1
Step 1: Analyze the graph to determine the function's domain. The domain of a function is the set of all possible x-values for which the function is defined. Since the graph extends infinitely to the left and right, the domain is all real numbers, which can be expressed as (-∞, ∞).
Step 2: Determine the function's range. The range is the set of all possible y-values that the function can take. Observing the graph, the lowest point is at y = 0, and the graph extends infinitely upward. Therefore, the range is [0, ∞).
Step 3: Identify the missing function values indicated by question marks. To do this, locate the x-values corresponding to the missing y-values on the graph. For example, if a specific x-value is given, find the corresponding y-value by observing the graph.
Step 4: Verify the vertex of the quadratic function. The vertex is the lowest point on the graph, which occurs at (0, 0). This confirms that the function has a minimum value at y = 0.
Step 5: Recognize the symmetry of the graph. The graph is symmetric about the vertical line x = 0, which is the axis of symmetry for this quadratic function. This property can help in determining missing values and understanding the behavior of the function.

Verified video answer for a similar problem:

This video solution was recommended by our tutors as helpful for the problem above.
Video duration:
3m
Was this helpful?

Key Concepts

Here are the essential concepts you must grasp in order to answer the question correctly.

Domain of a Function

The domain of a function refers to the set of all possible input values (x-values) for which the function is defined. In the context of a graph, it is represented by the horizontal extent of the graph. For the given quadratic function, the domain is typically all real numbers unless specified otherwise by restrictions.
Recommended video:
3:51
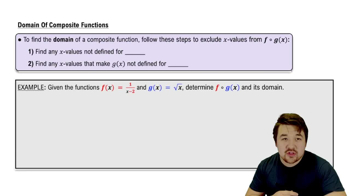
Domain Restrictions of Composed Functions

Range of a Function

The range of a function is the set of all possible output values (y-values) that the function can produce. This can be determined by observing the vertical extent of the graph. For the quadratic function shown, the range is influenced by the vertex and the direction of the parabola, indicating the minimum or maximum values it can achieve.
Recommended video:
4:22
Domain & Range of Transformed Functions

Finding Missing Function Values

Finding missing function values involves determining the y-values corresponding to specific x-values that may not be explicitly shown on the graph. This can be done by substituting the x-values into the function's equation or by visually interpreting the graph. In the case of the quadratic function, this may involve identifying points on the curve that correspond to the indicated question marks.
Recommended video:
3:43
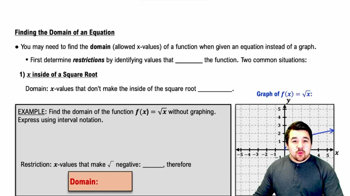
Finding the Domain of an Equation