3. Functions
Transformations
Problem 103
Textbook Question
The graph of a function ƒ is shown in the figure. Sketch the graph of each function defined as follows. 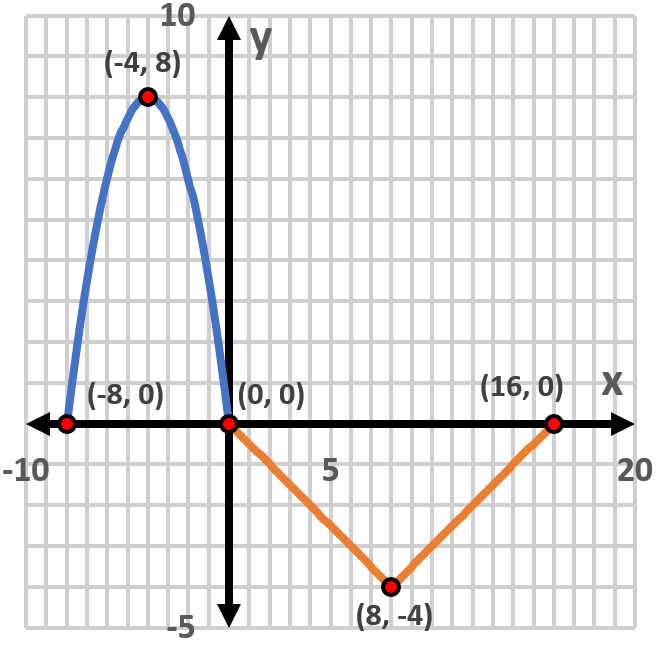
(c) y = ƒ(x+3) - 2
 Verified step by step guidance
1
Identify the original function f(x) from the graph. Note the key points: (-8, 0), (-4, 8), (0, 0), (8, -4), and (16, 0).
To sketch y = f(x + 3), shift the graph of f(x) horizontally to the left by 3 units. Adjust the key points accordingly: (-8, 0) becomes (-11, 0), (-4, 8) becomes (-7, 8), (0, 0) becomes (-3, 0), (8, -4) becomes (5, -4), and (16, 0) becomes (13, 0).
Next, to sketch y = f(x + 3) - 2, shift the graph of f(x + 3) vertically downward by 2 units. Adjust the key points accordingly: (-11, 0) becomes (-11, -2), (-7, 8) becomes (-7, 6), (-3, 0) becomes (-3, -2), (5, -4) becomes (5, -6), and (13, 0) becomes (13, -2).
Plot the new key points on the graph: (-11, -2), (-7, 6), (-3, -2), (5, -6), and (13, -2).
Connect the points smoothly, maintaining the shape of the original function f(x) to complete the graph of y = f(x + 3) - 2.
Recommended similar problem, with video answer:
Verified SolutionThis video solution was recommended by our tutors as helpful for the problem above
Video duration:
1mWas this helpful?
Key Concepts
Here are the essential concepts you must grasp in order to answer the question correctly.
Function Transformations
Function transformations involve altering the graph of a function through shifts, stretches, or reflections. In this case, the transformation y = ƒ(x + 3) - 2 indicates a horizontal shift to the left by 3 units and a vertical shift downward by 2 units. Understanding these transformations is crucial for accurately sketching the new graph based on the original function.
Recommended video:

 4:22
4:22Domain & Range of Transformed Functions
Horizontal Shifts
A horizontal shift occurs when the input of a function is adjusted by adding or subtracting a constant. For the function y = ƒ(x + 3), the graph shifts left by 3 units. This means that every point on the original graph will move leftward, affecting the x-coordinates of all key points while keeping their y-coordinates unchanged.
Recommended video:
 5:34
5:34Shifts of Functions
Vertical Shifts
A vertical shift modifies the output of a function by adding or subtracting a constant. In the transformation y = ƒ(x + 3) - 2, the graph shifts downward by 2 units. This adjustment affects the y-coordinates of all points on the graph, resulting in a new position for each point while maintaining the same horizontal alignment.
Recommended video:
5:34Shifts of Functions
 5:25m
5:25mWatch next
Master Intro to Transformations with a bite sized video explanation from Nick Kaneko
Start learningRelated Videos
Related Practice