2. Graphs of Equations
Lines
Problem 59
Textbook Question
Textbook QuestionGraph the line passing through the given point and having the indicated slope. Plot two points on the line. See Example 7. through (3, -4), m = - 1/3
 Verified Solution
This video solution was recommended by our tutors as helpful for the problem above
Video duration:
6mWas this helpful?
Key Concepts
Here are the essential concepts you must grasp in order to answer the question correctly.
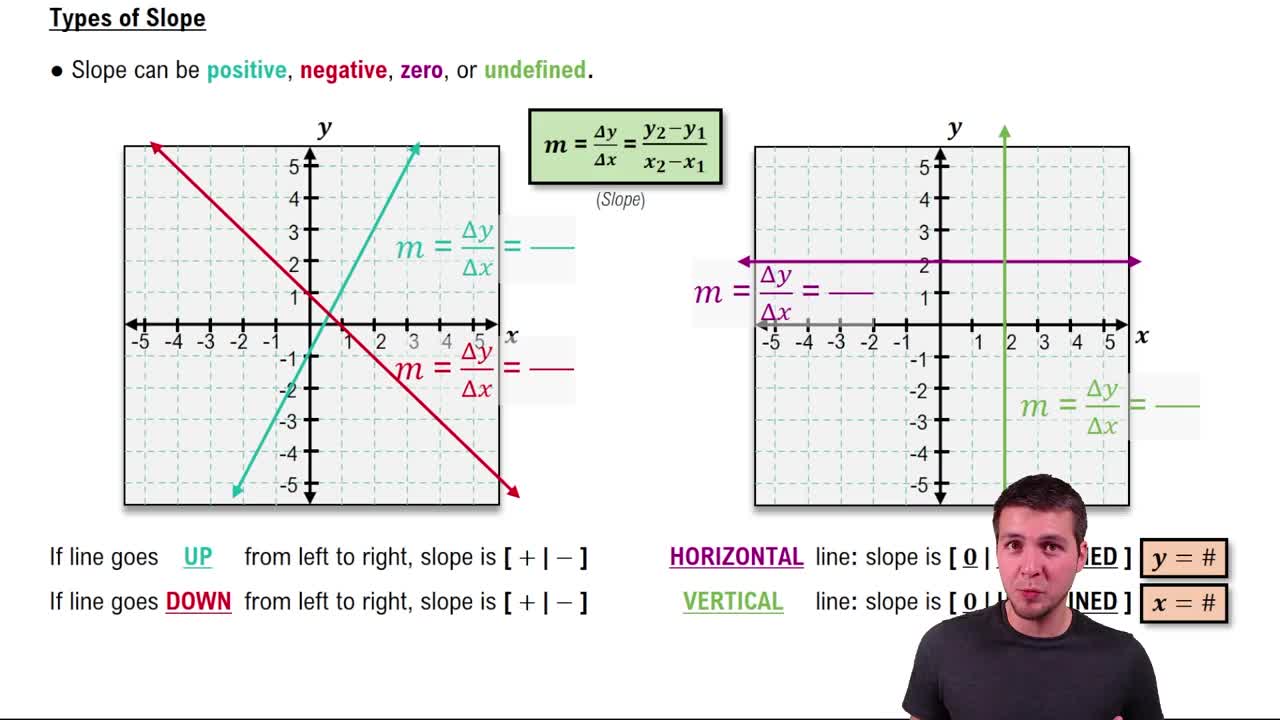
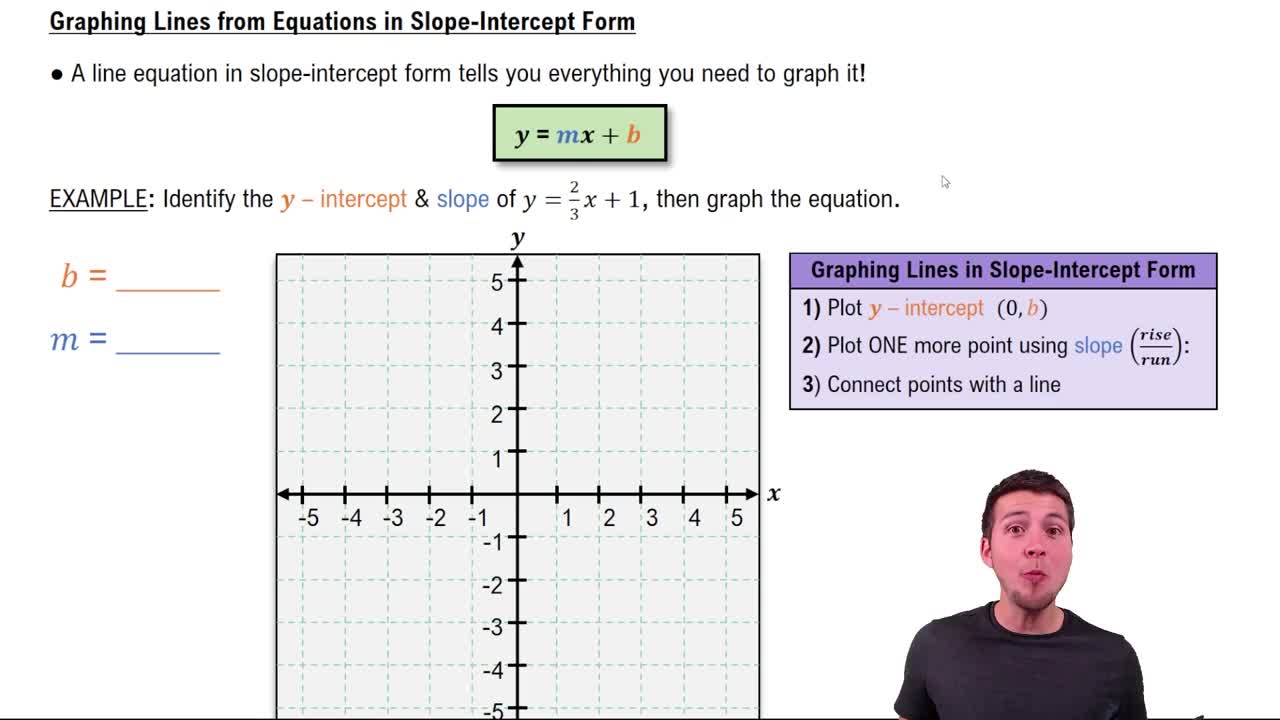
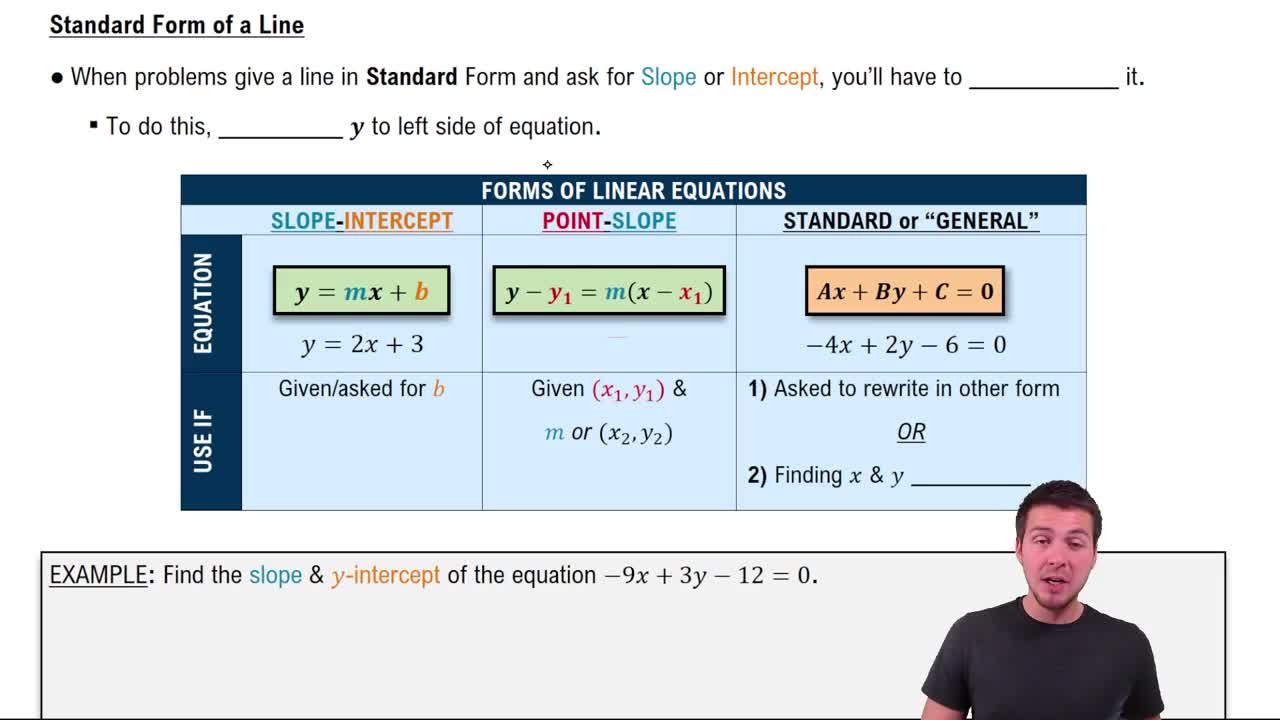
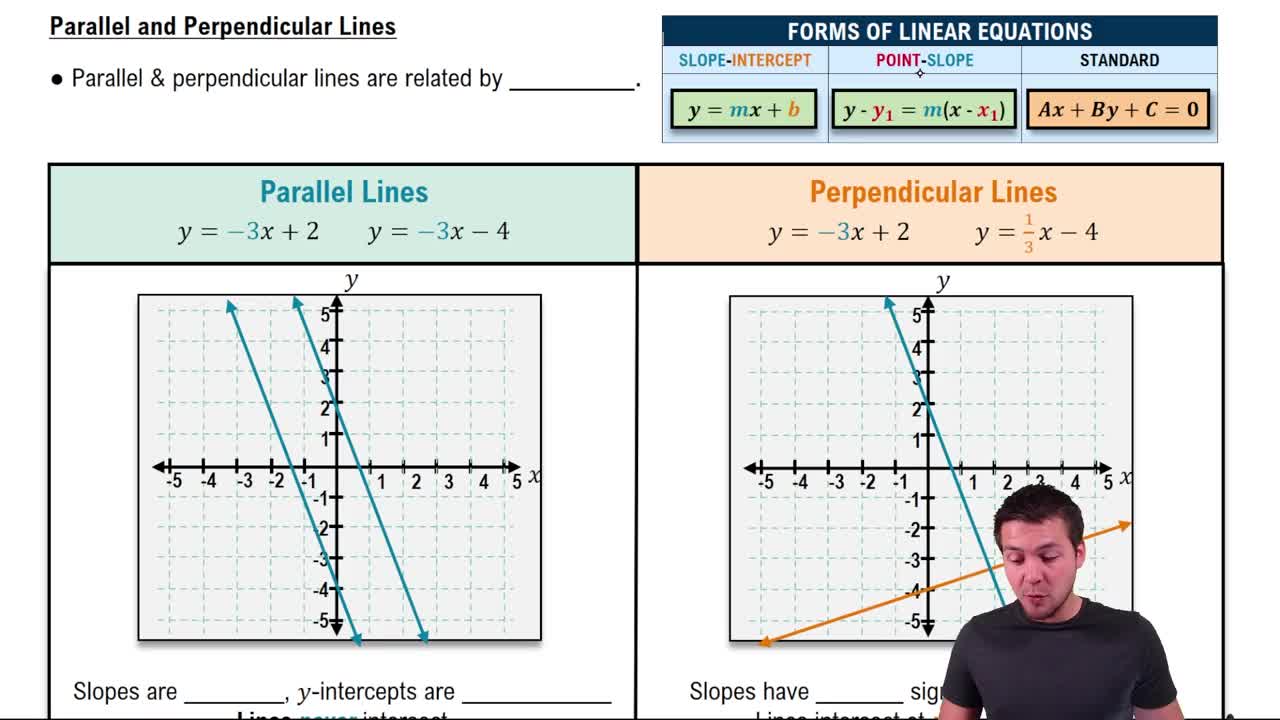
Slope-Intercept Form
The slope-intercept form of a linear equation is expressed as y = mx + b, where m represents the slope and b is the y-intercept. This form is useful for quickly identifying the slope of a line and where it crosses the y-axis. Understanding this format allows students to easily graph lines by starting at the y-intercept and using the slope to find additional points.
Recommended video:
Guided course

 03:56
03:56Slope-Intercept Form
Point-Slope Form
The point-slope form of a linear equation is given by y - y1 = m(x - x1), where (x1, y1) is a specific point on the line and m is the slope. This form is particularly helpful when you know a point on the line and the slope, as it allows you to derive the equation of the line directly. It is a practical tool for graphing lines when starting from a known point.
Recommended video:
Guided course
 05:46
05:46Point-Slope Form
Graphing Linear Equations
Graphing linear equations involves plotting points on a coordinate plane that satisfy the equation of the line. To graph a line, you typically need at least two points, which can be found using the slope and a known point. By connecting these points, you create a visual representation of the linear relationship, which helps in understanding the behavior of the equation across different values.
Recommended video:
 06:00
06:00Categorizing Linear Equations
 6:49m
6:49mWatch next
Master The Slope of a Line with a bite sized video explanation from Patrick Ford
Start learningRelated Videos
Related Practice