7. Systems of Equations & Matrices
Graphing Systems of Inequalities
Problem 9
Textbook Question
In Exercises 5–14, an objective function and a system of linear inequalities representing constraints are given.
a. Graph the system of inequalities representing the constraints.
b. Find the value of the objective function at each corner of the graphed region. c. Use the values in part (b) to determine the maximum value of the objective function and the values of x and y for which the maximum occurs.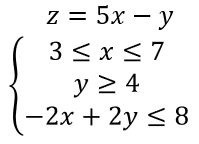
 Verified step by step guidance
1
Graph the inequalities on a coordinate plane: 3 \leq x \leq 7, y \geq 4, and -2x + 2y \leq 8.
Identify the feasible region where all inequalities overlap.
Determine the corner points of the feasible region by solving the system of equations formed by the intersection of the boundary lines.
Evaluate the objective function z = 5x - y at each corner point of the feasible region.
Compare the values obtained in the previous step to find the maximum value of the objective function and the corresponding values of x and y.
Recommended similar problem, with video answer:
Verified SolutionThis video solution was recommended by our tutors as helpful for the problem above
Video duration:
13mWas this helpful?
Key Concepts
Here are the essential concepts you must grasp in order to answer the question correctly.
Graphing Linear Inequalities
Graphing linear inequalities involves representing the solutions of an inequality on a coordinate plane. Each inequality corresponds to a region on the graph, which is determined by the boundary line. The area above or below the line, depending on the inequality sign, indicates where the solutions lie. Understanding how to graph these inequalities is crucial for visualizing the feasible region in optimization problems.
Recommended video:

 06:07
06:07Linear Inequalities
Objective Function
An objective function is a mathematical expression that defines the goal of an optimization problem, typically to maximize or minimize a certain quantity. In this context, the objective function is represented as 'z = 5x - y', where 'z' depends on the variables 'x' and 'y'. Evaluating this function at the vertices of the feasible region allows us to determine the optimal solution that meets the constraints.
Recommended video:
 6:37
6:37Permutations of Non-Distinct Objects
Feasible Region and Corner Points
The feasible region is the area on the graph where all constraints of the inequalities are satisfied simultaneously. The corner points, or vertices, of this region are critical because, according to the Fundamental Theorem of Linear Programming, the maximum or minimum value of the objective function occurs at one of these points. Identifying and evaluating these corner points is essential for solving the optimization problem effectively.
Recommended video:
Guided course
 05:46
05:46Point-Slope Form
 7:2m
7:2mWatch next
Master Linear Inequalities with a bite sized video explanation from Patrick Ford
Start learning


