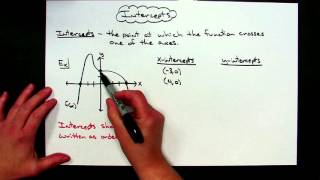
2. Graphs of Equations
Graphs and Coordinates
Problem 20a
Textbook Question
Graph each equation in Exercises 13 - 28. Let x = - 3, - 2, - 1, 0, 1, 2, 3 y = - (1/2)x + 2
 Verified step by step guidance
1
Identify the equation of the line: \( y = -\frac{1}{2}x + 2 \). This is in the slope-intercept form \( y = mx + b \), where \( m \) is the slope and \( b \) is the y-intercept.
Determine the slope \( m \) and y-intercept \( b \) from the equation. Here, \( m = -\frac{1}{2} \) and \( b = 2 \).
Create a table of values by substituting each given \( x \) value into the equation to find the corresponding \( y \) values. For example, for \( x = -3 \), calculate \( y = -\frac{1}{2}(-3) + 2 \).
Plot the points \((x, y)\) on a coordinate plane using the values from your table. For instance, plot the point for \( x = -3 \) and its corresponding \( y \) value.
Draw a straight line through the plotted points to represent the graph of the equation. Ensure the line extends in both directions and passes through the y-intercept at \( (0, 2) \).
Recommended similar problem, with video answer:
Verified SolutionThis video solution was recommended by our tutors as helpful for the problem above
Video duration:
1mWas this helpful?
Key Concepts
Here are the essential concepts you must grasp in order to answer the question correctly.
Linear Equations
A linear equation is an algebraic expression that represents a straight line when graphed on a coordinate plane. It typically takes the form y = mx + b, where m is the slope and b is the y-intercept. Understanding linear equations is essential for graphing, as it allows students to identify how changes in x affect y.
Recommended video:

 06:00
06:00Categorizing Linear Equations
Slope-Intercept Form
The slope-intercept form of a linear equation is expressed as y = mx + b, where m represents the slope of the line and b represents the y-intercept. The slope indicates the steepness and direction of the line, while the y-intercept is the point where the line crosses the y-axis. This form is particularly useful for quickly identifying key characteristics of the graph.
Recommended video:
Guided course
 03:56
03:56Slope-Intercept Form
Graphing Points
Graphing points involves plotting specific (x, y) coordinates on a Cartesian plane. For the given equation, substituting values of x allows us to calculate corresponding y values, creating a set of points that can be plotted. Understanding how to graph points is crucial for visualizing the relationship defined by the equation and for accurately drawing the line.
Recommended video:
Guided course
 04:29
04:29Graphing Equations of Two Variables by Plotting Points
 5:10m
5:10mWatch next
Master Graphs & the Rectangular Coordinate System with a bite sized video explanation from Patrick Ford
Start learningRelated Videos
Related Practice