Table of contents
- 0. Review of Algebra4h 16m
- 1. Equations & Inequalities3h 18m
- 2. Graphs of Equations43m
- 3. Functions2h 17m
- 4. Polynomial Functions1h 44m
- 5. Rational Functions1h 23m
- 6. Exponential & Logarithmic Functions2h 28m
- 7. Systems of Equations & Matrices4h 6m
- 8. Conic Sections2h 23m
- 9. Sequences, Series, & Induction1h 19m
- 10. Combinatorics & Probability1h 45m
7. Systems of Equations & Matrices
Graphing Systems of Inequalities
Problem 17
Textbook Question
In Exercises 1–26, graph each inequality. (x−2)^2+(y+1)^2<9
 Verified step by step guidance
1
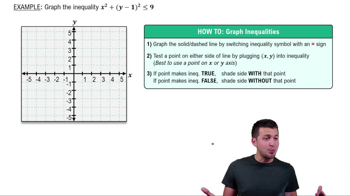
<Identify the inequality as a circle centered at (2, -1) with a radius of 3.>
<Rewrite the inequality in the form (x - h)^2 + (y - k)^2 < r^2, where (h, k) is the center and r is the radius.>
<Recognize that the inequality (x - 2)^2 + (y + 1)^2 < 9 represents the interior of a circle.>
<Graph the circle with center (2, -1) and radius 3, but use a dashed line to indicate that points on the circle are not included.>
<Shade the region inside the circle to represent all the points (x, y) that satisfy the inequality.>
Recommended similar problem, with video answer:
 Verified Solution
This video solution was recommended by our tutors as helpful for the problem above
Video duration:
6mPlay a video:
Was this helpful?
Key Concepts
Here are the essential concepts you must grasp in order to answer the question correctly.
Inequalities
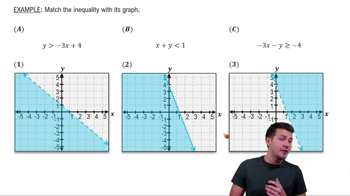
Inequalities express a relationship where one quantity is not equal to another, often using symbols like <, >, ≤, or ≥. In this case, the inequality (x−2)²+(y+1)²<9 indicates that we are looking for all points (x, y) that satisfy this condition, which defines a region rather than a specific value.
Recommended video:

Linear Inequalities
Graphing Circles
The given inequality represents a circle centered at the point (2, -1) with a radius of 3, since the expression (x−2)²+(y+1)²=9 describes a circle. When graphing, the area inside the circle is included because of the '<' symbol, indicating that points within this radius are part of the solution set.
Recommended video:

Circles in Standard Form
Coordinate Plane
The coordinate plane is a two-dimensional surface defined by an x-axis (horizontal) and a y-axis (vertical). Understanding how to plot points and shapes on this plane is essential for graphing inequalities, as it allows for visual representation of the solution set, helping to identify which regions satisfy the given inequality.
Recommended video:
Guided course

Graphs & the Rectangular Coordinate System

 7:2m
7:2mWatch next
Master Linear Inequalities with a bite sized video explanation from Patrick Ford
Start learning


