2. Graphs of Equations
Lines
Problem 68a
Textbook Question
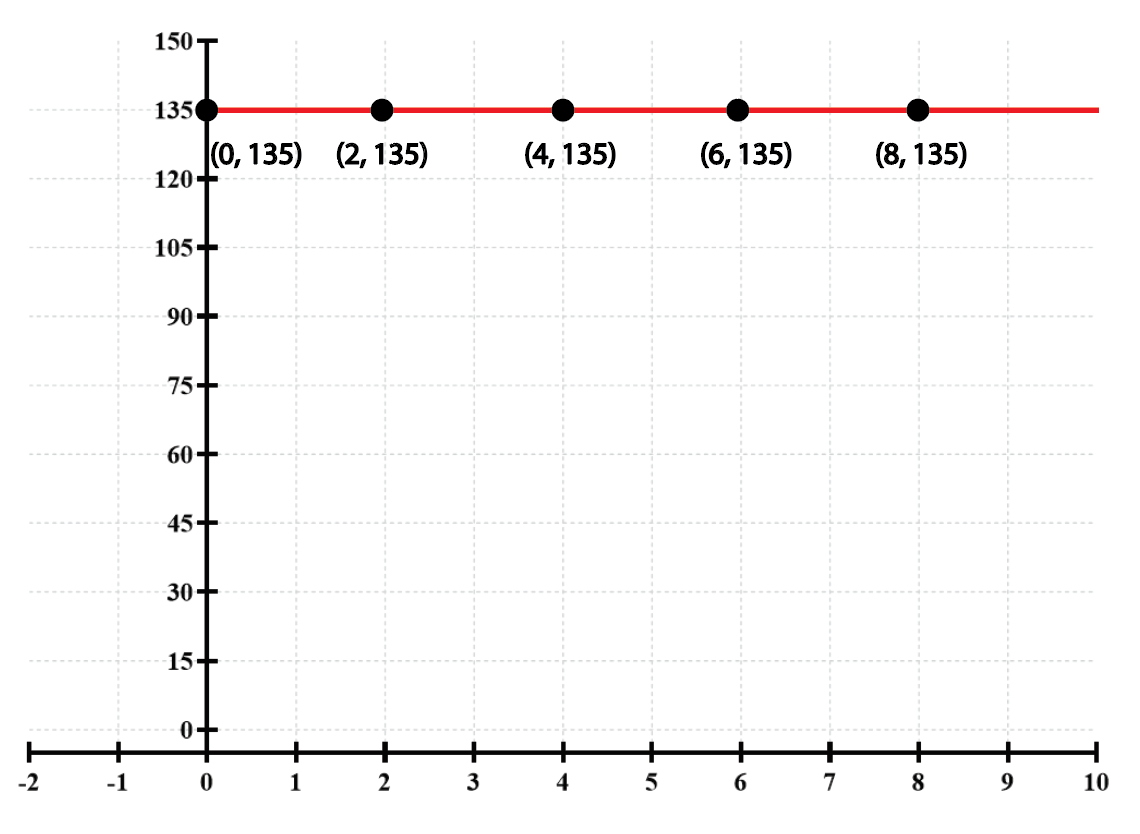
Textbook QuestionFind and interpret the average rate of change illustrated in each graph.
 Verified Solution
This video solution was recommended by our tutors as helpful for the problem above
Video duration:
3m305
views
Was this helpful?
Related Videos
Related Practice

 06:49
06:49


Showing 1 of 11 videos