2. Graphs of Equations
Lines
Problem 68a
Textbook Question
Textbook QuestionFind and interpret the average rate of change illustrated in each graph. 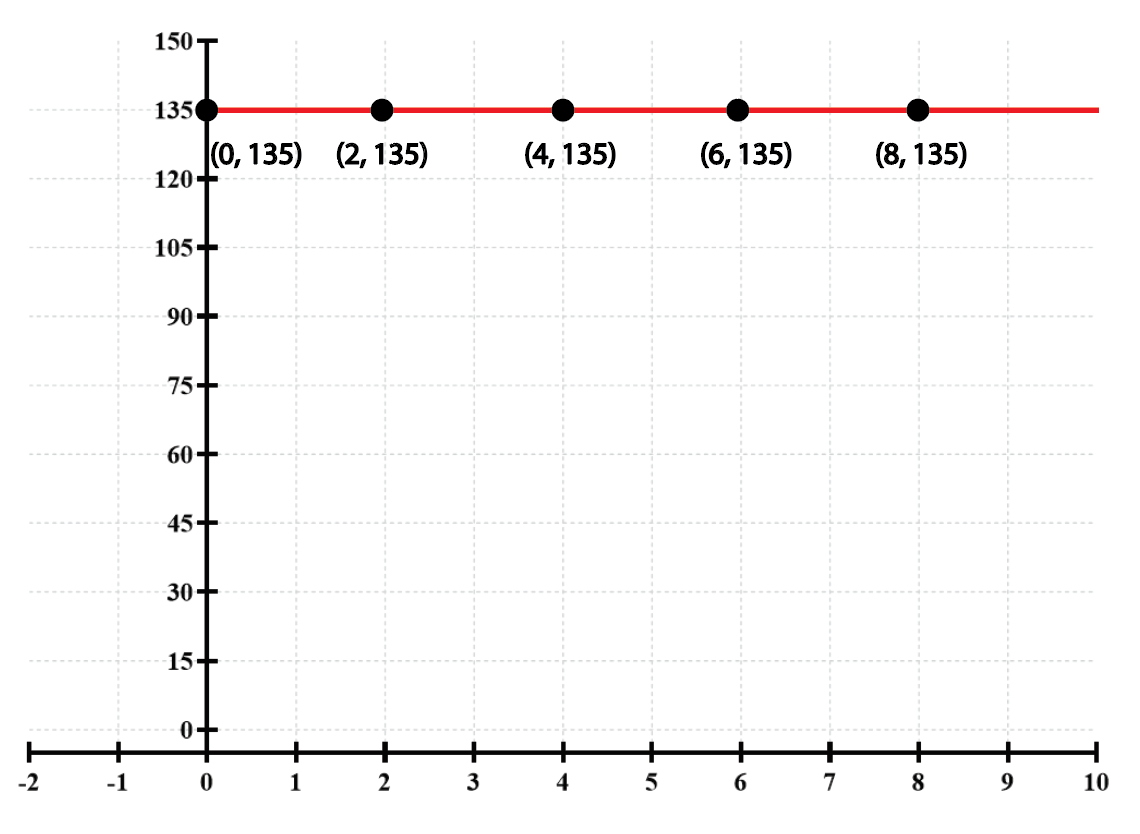
 Verified Solution
This video solution was recommended by our tutors as helpful for the problem above
Video duration:
3mWas this helpful?
Key Concepts
Here are the essential concepts you must grasp in order to answer the question correctly.
Average Rate of Change
The average rate of change of a function over an interval is calculated as the change in the function's value divided by the change in the input value. Mathematically, it is expressed as (f(b) - f(a)) / (b - a), where [a, b] is the interval. This concept helps in understanding how a function behaves over a specific range.
Recommended video:

 5:36
5:36Change of Base Property
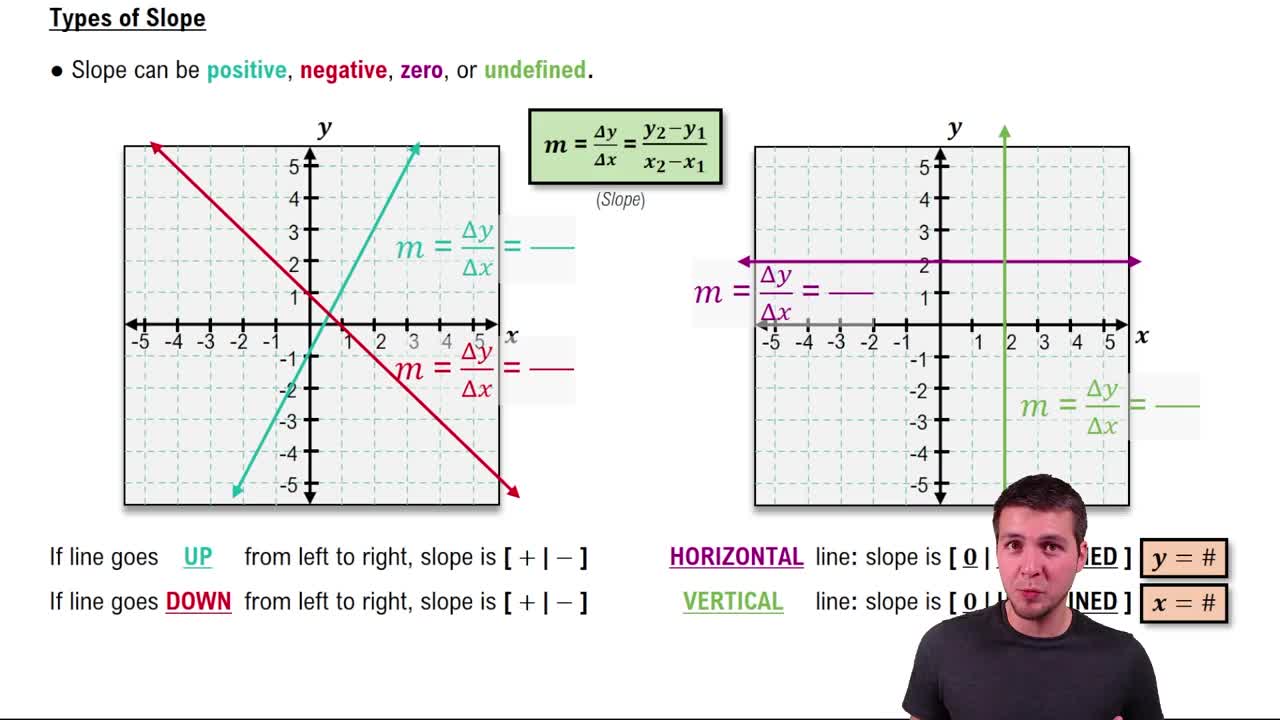
Horizontal Line
A horizontal line on a graph indicates that the value of the function remains constant regardless of changes in the input variable. In this case, the line at y=135 shows that for all x-values, the output is consistently 135, demonstrating no change in value, which directly affects the average rate of change.
Recommended video:
Guided course
 06:49
06:49The Slope of a Line
Graph Interpretation
Interpreting a graph involves analyzing its features, such as slopes, intercepts, and overall shape, to understand the relationship between variables. In this question, recognizing that the graph is a horizontal line allows for the conclusion that the average rate of change is zero, as there is no vertical change across the specified x-values.
Recommended video:
Guided course
 02:16
02:16Graphs and Coordinates - Example
 6:49m
6:49mWatch next
Master The Slope of a Line with a bite sized video explanation from Patrick Ford
Start learningRelated Videos
Related Practice