2. Graphs of Equations
Two-Variable Equations
Problem 1b
Textbook Question
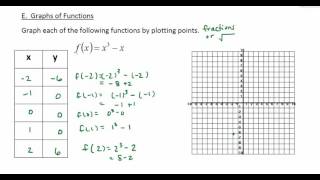
Graph each equation in Exercises 1–4. Let x= -3, -2. -1, 0, 1, 2 and 3. y = 2x-2
 Verified step by step guidance
1
<Step 1: Understand the equation. The given equation is y = 2x - 2, which is a linear equation in the form y = mx + b, where m is the slope and b is the y-intercept.>
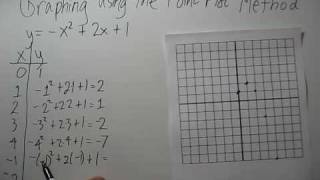
<Step 2: Create a table of values. Use the given x-values (-3, -2, -1, 0, 1, 2, 3) to calculate the corresponding y-values using the equation y = 2x - 2.>
<Step 3: Calculate y-values. Substitute each x-value into the equation to find the corresponding y-value. For example, for x = -3, calculate y = 2(-3) - 2. Repeat this for each x-value.>
<Step 4: Plot the points. Once you have the (x, y) pairs from the table, plot these points on a coordinate plane.>
<Step 5: Draw the line. Connect the plotted points with a straight line, as the equation represents a linear function. This line is the graph of the equation y = 2x - 2.>
Recommended similar problem, with video answer:
Verified SolutionThis video solution was recommended by our tutors as helpful for the problem above
Video duration:
1mWas this helpful?
Key Concepts
Here are the essential concepts you must grasp in order to answer the question correctly.
Linear Equations
A linear equation is an algebraic expression that represents a straight line when graphed on a coordinate plane. It typically takes the form y = mx + b, where m is the slope and b is the y-intercept. Understanding linear equations is essential for graphing, as it allows you to determine how changes in x affect the value of y.
Recommended video:

 06:00
06:00Categorizing Linear Equations
Slope and Y-Intercept
The slope of a line indicates its steepness and direction, calculated as the change in y over the change in x (rise/run). The y-intercept is the point where the line crosses the y-axis, representing the value of y when x is zero. In the equation y = 2x - 2, the slope is 2 and the y-intercept is -2, which are crucial for accurately plotting the graph.
Recommended video:
Guided course
 03:56
03:56Slope-Intercept Form
Graphing Points
Graphing points involves plotting specific (x, y) coordinates on a Cartesian plane. For the equation y = 2x - 2, you will substitute the given x values (-3, -2, -1, 0, 1, 2, 3) to find corresponding y values. This process helps visualize the relationship between x and y, forming the linear graph of the equation.
Recommended video:
Guided course
 04:29
04:29Graphing Equations of Two Variables by Plotting Points
 5:28m
5:28mWatch next
Master Equations with Two Variables with a bite sized video explanation from Patrick Ford
Start learningRelated Videos
Related Practice