Table of contents
- 0. Review of Algebra4h 16m
- 1. Equations & Inequalities3h 18m
- 2. Graphs of Equations43m
- 3. Functions2h 17m
- 4. Polynomial Functions1h 44m
- 5. Rational Functions1h 23m
- 6. Exponential & Logarithmic Functions2h 28m
- 7. Systems of Equations & Matrices4h 6m
- 8. Conic Sections2h 23m
- 9. Sequences, Series, & Induction1h 19m
- 10. Combinatorics & Probability1h 45m
3. Functions
Intro to Functions & Their Graphs
Problem 56c
Textbook Question
Graph each function. Give the domain and range. See Example 3. g(x)=[[2x-1]]
 Verified step by step guidance
1
<Step 1: Understand the function notation. The function g(x) = [[2x - 1]] uses the greatest integer function, also known as the floor function, which returns the greatest integer less than or equal to the input.>
<Step 2: Analyze the expression inside the function. The expression 2x - 1 is a linear function, which means it will produce a straight line when graphed.>
<Step 3: Determine the domain of the function. Since 2x - 1 is a linear function, it is defined for all real numbers. Therefore, the domain of g(x) is all real numbers, or (-∞, ∞).>
<Step 4: Determine the range of the function. The greatest integer function outputs integer values. Therefore, the range of g(x) will be all integers, or {..., -2, -1, 0, 1, 2, ...}.>
<Step 5: Sketch the graph. Plot the line y = 2x - 1 and apply the greatest integer function to each point, which will create a step-like graph where each step is one unit high and spans from one integer to the next.>
Recommended similar problem, with video answer:
 Verified Solution
This video solution was recommended by our tutors as helpful for the problem above
Video duration:
14mPlay a video:
Was this helpful?
Key Concepts
Here are the essential concepts you must grasp in order to answer the question correctly.
Graphing Functions
Graphing functions involves plotting points on a coordinate plane to visually represent the relationship between the input (x-values) and output (y-values) of a function. Understanding how to interpret the shape of the graph helps in analyzing the behavior of the function, such as identifying intercepts, slopes, and asymptotes.
Recommended video:

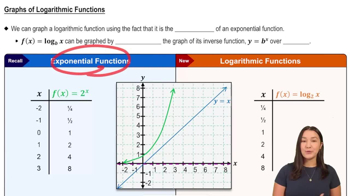
Graphs of Logarithmic Functions
Domain and Range
The domain of a function refers to the set of all possible input values (x-values) that the function can accept, while the range is the set of all possible output values (y-values) that the function can produce. Identifying the domain and range is crucial for understanding the limitations and behavior of the function across its graph.
Recommended video:

Domain & Range of Transformed Functions
Greatest Integer Function
The greatest integer function, denoted as [[x]], returns the largest integer less than or equal to x. This piecewise function creates a step-like graph, where each interval corresponds to a specific integer value. Understanding this function is essential for accurately graphing and determining the domain and range of g(x) = [[2x - 1]].
Recommended video:

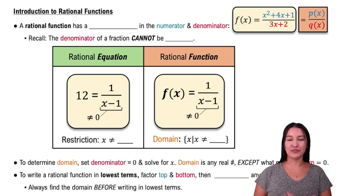
Intro to Rational Functions

 5:2m
5:2mWatch next
Master Relations and Functions with a bite sized video explanation from Nick Kaneko
Start learningRelated Videos
Related Practice


