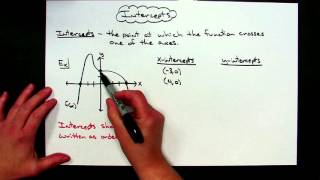
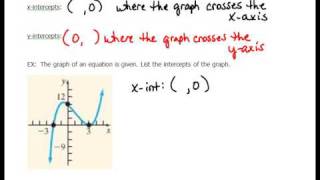
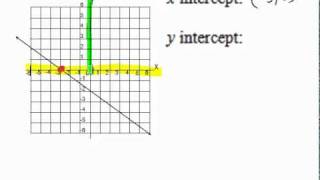
2. Graphs of Equations
Graphs and Coordinates
Problem 51a
Textbook Question
Textbook QuestionIn Exercises 47–50, write each English sentence as an equation in two variables. Then graph the equation. y = 5 (Let x = -3, - 2, - 1, 0, 1, 2, and 3.)
 Verified Solution
This video solution was recommended by our tutors as helpful for the problem above
Video duration:
2mWas this helpful?
Key Concepts
Here are the essential concepts you must grasp in order to answer the question correctly.
Linear Equations
A linear equation in two variables is an equation that can be expressed in the form y = mx + b, where m represents the slope and b represents the y-intercept. This type of equation describes a straight line when graphed on a coordinate plane. Understanding linear equations is essential for translating English sentences into mathematical expressions.
Recommended video:

 06:00
06:00Categorizing Linear Equations
Graphing Techniques
Graphing techniques involve plotting points on a coordinate plane to visually represent equations. For linear equations, you can find points by substituting values for x and calculating the corresponding y values. This process helps in understanding the relationship between the variables and the overall behavior of the equation.
Recommended video:
Guided course
 02:16
02:16Graphs and Coordinates - Example
Substitution Method
The substitution method is a technique used to evaluate equations by replacing variables with specific values. In this context, substituting values for x allows you to find the corresponding y values for the equation y = 5. This method is crucial for generating points that can be plotted to graph the equation accurately.
Recommended video:
 04:03
04:03Choosing a Method to Solve Quadratics
 5:10m
5:10mWatch next
Master Graphs & the Rectangular Coordinate System with a bite sized video explanation from Patrick Ford
Start learningRelated Videos
Related Practice