Ch. 4 - Exponential and Logarithmic Functions
Blitzer - College Algebra 8th Edition
Blitzer8th EditionCollege AlgebraISBN: 9780136970514Not the one you use?Change textbook
Chapter 5, Problem 61

Give the equation of each exponential function whose graph is shown.
Graph of an exponential function with points (0,1), (1,4), and (2,16).

Verified step by step guidance
1
Identify the general form of an exponential function: \(y = a \cdot b^x\), where \(a\) is the initial value (the value when \(x=0\)) and \(b\) is the base or growth factor.
For the first graph, use the point where \(x=0\) to find \(a\). Since the point is \((0, 2)\), substitute to get \(a = 2\). So the function starts as \(y = 2 \cdot b^x\).
Use another point from the first graph, for example \((1, 4)\), and substitute into the equation: \(4 = 2 \cdot b^1\). Solve for \(b\) by dividing both sides by 2, giving \(b = 2\).
Write the equation for the first graph as \(y = 2 \cdot 2^x\) after finding \(a\) and \(b\).
Repeat the process for the second graph: start with the point \((0, 1)\) to find \(a = 1\), so \(y = 1 \cdot b^x = b^x\). Use the point \((1, 4)\) to find \(b\) by substituting: \$4 = b^1\(, so \)b = 4\(. The equation for the second graph is \)y = 4^x$.

Verified video answer for a similar problem:

This video solution was recommended by our tutors as helpful for the problem above.
Video duration:
3m
Was this helpful?

Key Concepts

Here are the essential concepts you must grasp in order to answer the question correctly.

Exponential Function Form

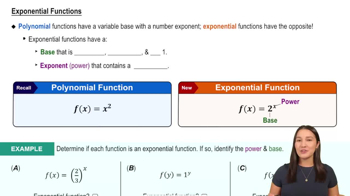
An exponential function is generally written as y = ab^x, where 'a' is the initial value (y-intercept) and 'b' is the base or growth factor. Understanding this form helps in identifying the equation from given points on the graph.
Recommended video:
6:13
Exponential Functions

Using Points to Find Parameters

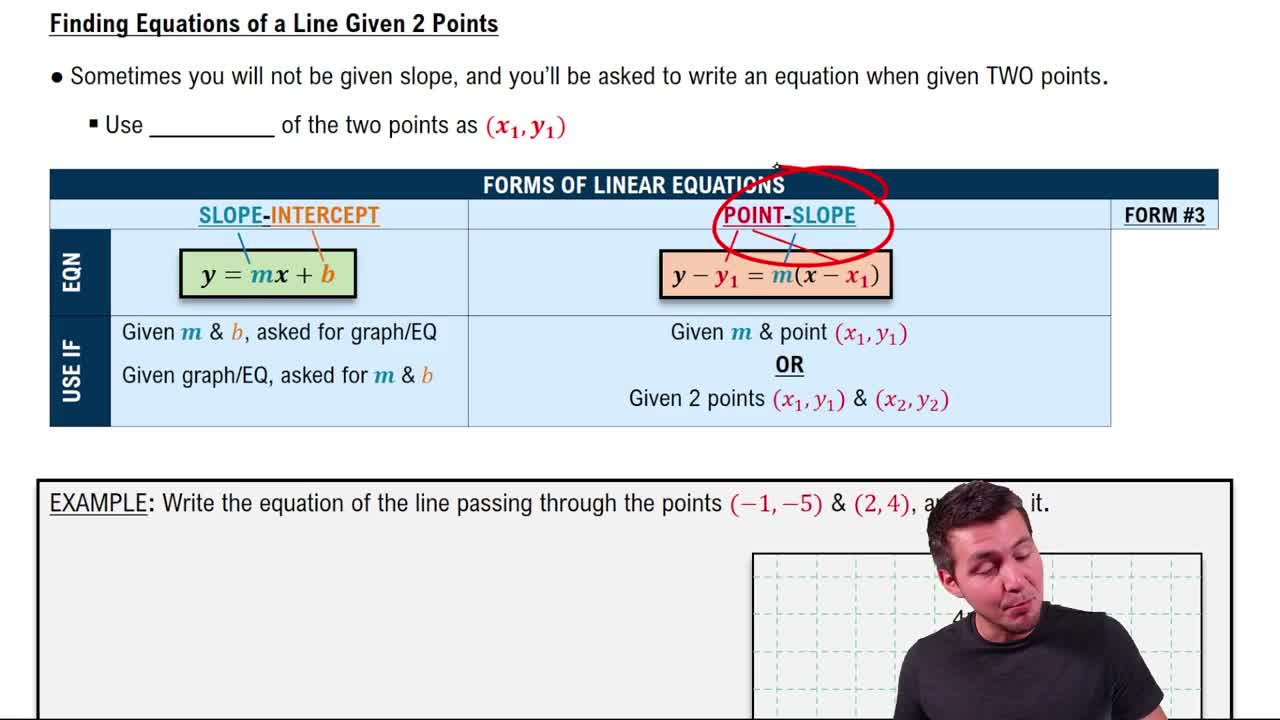
Given points on the graph, especially the y-intercept (where x=0), you can find 'a' directly. Then, using another point, substitute x and y values to solve for the base 'b'. This process is essential to determine the exact equation of the exponential function.
Recommended video:
Guided course
04:27
Finding Equations of Lines Given Two Points

Graph Interpretation and Growth Behavior

The shape of the graph shows exponential growth if it rises rapidly as x increases. Recognizing this behavior confirms the base 'b' is greater than 1. The plotted points (0,2), (1,4), and (2,8) indicate doubling behavior, which helps in identifying the base.
Recommended video:
05:01
Identifying Intervals of Unknown Behavior
Related Practice
Textbook Question

In Exercises 60–63, determine whether each equation is true or false. Where possible, show work to support your conclusion. If the statement is false, make the necessary change(s) to produce a true statement. (ln x)(ln 1) = 0

747
views
Textbook Question

The figure shows the graph of f(x) = log x. In Exercises 59–64, use transformations of this graph to graph each function. Graph and give equations of the asymptotes. Use the graphs to determine each function's domain and range. h(x) = log x − 1

577
views
Textbook Question

Solve each logarithmic equation in Exercises 49–92. Be sure to reject any value of x that is not in the domain of the original logarithmic expressions. Give the exact answer. Then, where necessary, use a calculator to obtain a decimal approximation, correct to two decimal places, for the solution. log4(3x+2)=3

730
views
Textbook Question

Use properties of logarithms to condense each logarithmic expression. Write the expression as a single logarithm whose coefficient is 1. Where possible, evaluate logarithmic expressions without using a calculator. 3 ln x + 5 ln y - 6 ln z

1026
views
Textbook Question

Solve each logarithmic equation in Exercises 49–92. Be sure to reject any value of x that is not in the domain of the original logarithmic expressions. Give the exact answer. Then, where necessary, use a calculator to obtain a decimal approximation, correct to two decimal places, for the solution. 5 ln(2x)=20

809
views
Textbook Question

The figure shows the graph of f(x) = log x. In Exercises 59–64, use transformations of this graph to graph each function. Graph and give equations of the asymptotes. Use the graphs to determine each function's domain and range. g(x) = log(x − 1)

580
views