6. Exponential & Logarithmic Functions
Introduction to Logarithms
Problem 39a
Textbook Question
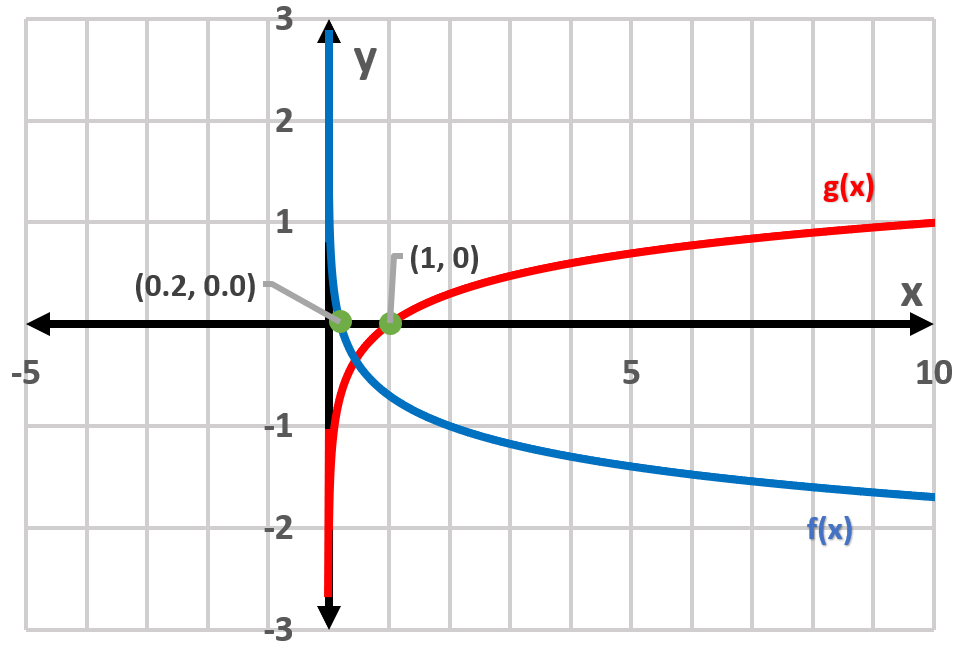
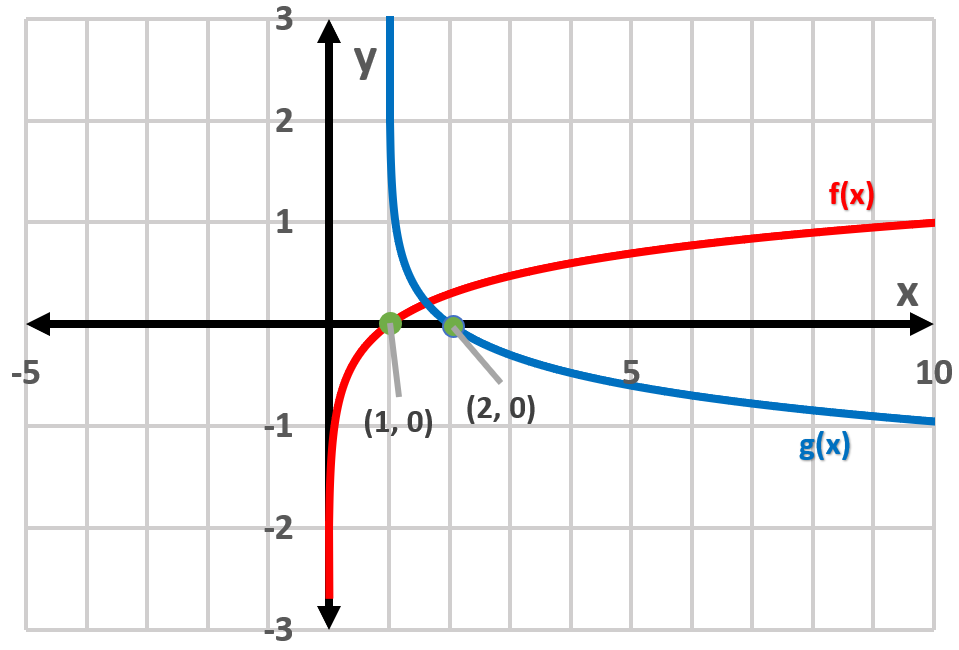
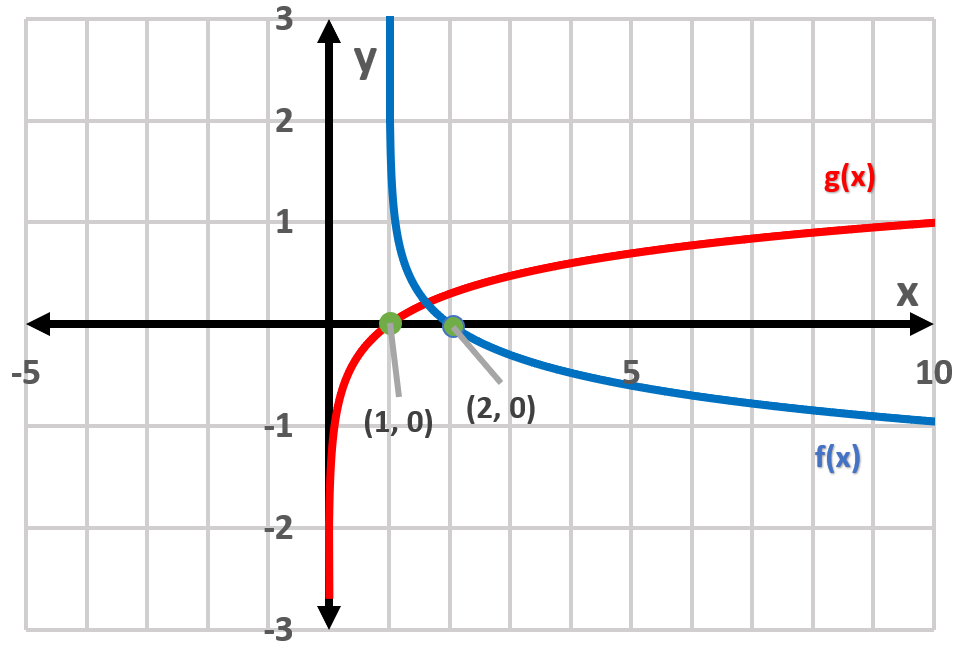
Textbook QuestionIn Exercises 39–40, graph f and g in the same rectangular coordinate system. Use transformations of the graph of f to obtain the graph of g. Graph and give equations of all asymptotes. Use the graphs to determine each function's domain and range. f(x) = log x and g(x) = - log (x+3)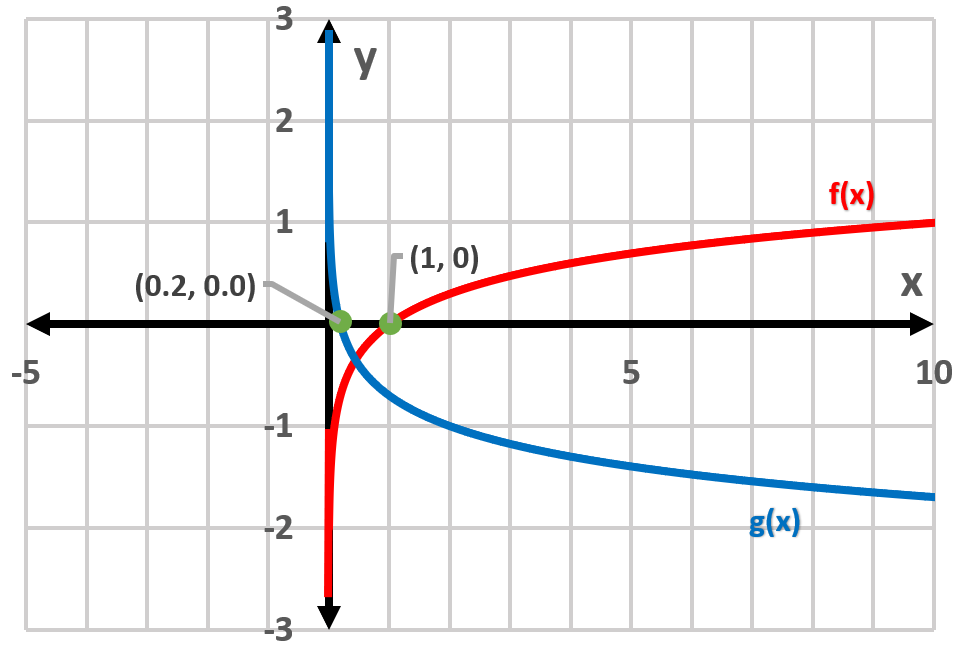
 Verified Solution
This video solution was recommended by our tutors as helpful for the problem above
Video duration:
13mWas this helpful?
Key Concepts
Here are the essential concepts you must grasp in order to answer the question correctly.
Logarithmic Functions
Logarithmic functions, such as f(x) = log(x), are the inverses of exponential functions. They are defined for positive real numbers and have a vertical asymptote at x = 0. The graph of a logarithmic function increases slowly and approaches the x-axis but never touches it, indicating that the function's range is all real numbers.
Recommended video:

 5:26
5:26Graphs of Logarithmic Functions
Transformations of Functions
Transformations of functions involve shifting, reflecting, stretching, or compressing the graph of a function. For example, g(x) = -log(x + 3) represents a vertical reflection of f(x) = log(x) and a horizontal shift to the left by 3 units. Understanding these transformations is crucial for accurately graphing related functions.
Recommended video:
 4:22
4:22Domain & Range of Transformed Functions
Asymptotes
Asymptotes are lines that a graph approaches but never touches. For logarithmic functions, vertical asymptotes occur where the function is undefined, such as at x = 0 for f(x) = log(x). In the case of g(x) = -log(x + 3), the vertical asymptote is at x = -3, indicating the domain of the function is x > -3.
Recommended video:
 6:24
6:24Introduction to Asymptotes
 7:3m
7:3mWatch next
Master Logarithms Introduction with a bite sized video explanation from Callie
Start learning


