Table of contents
- 0. Review of Algebra4h 16m
- 1. Equations & Inequalities3h 18m
- 2. Graphs of Equations43m
- 3. Functions2h 17m
- 4. Polynomial Functions1h 44m
- 5. Rational Functions1h 23m
- 6. Exponential & Logarithmic Functions2h 28m
- 7. Systems of Equations & Matrices4h 6m
- 8. Conic Sections2h 23m
- 9. Sequences, Series, & Induction1h 19m
- 10. Combinatorics & Probability1h 45m
6. Exponential & Logarithmic Functions
Introduction to Logarithms
Problem 39a
Textbook Question
In Exercises 39–40, graph f and g in the same rectangular coordinate system. Use transformations of the graph of f to obtain the graph of g. Graph and give equations of all asymptotes. Use the graphs to determine each function's domain and range. f(x) = log x and g(x) = - log (x+3)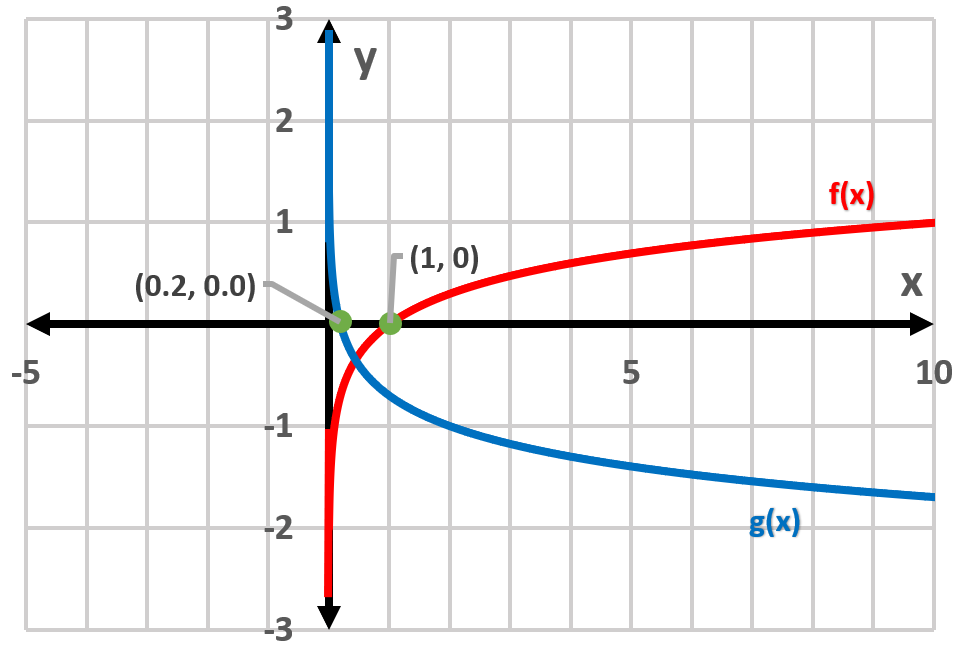
 Verified step by step guidance
1
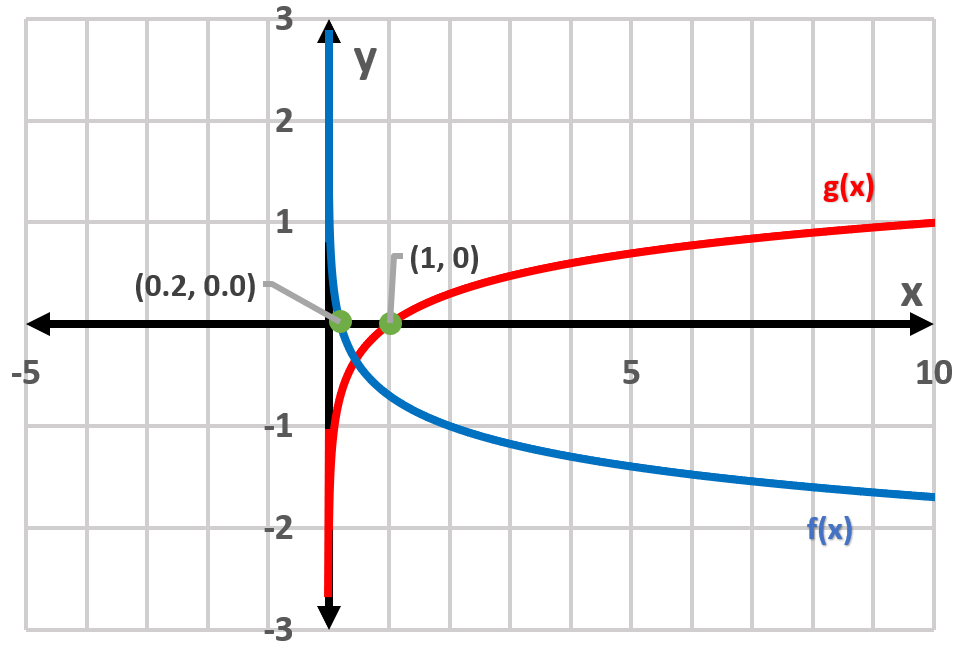
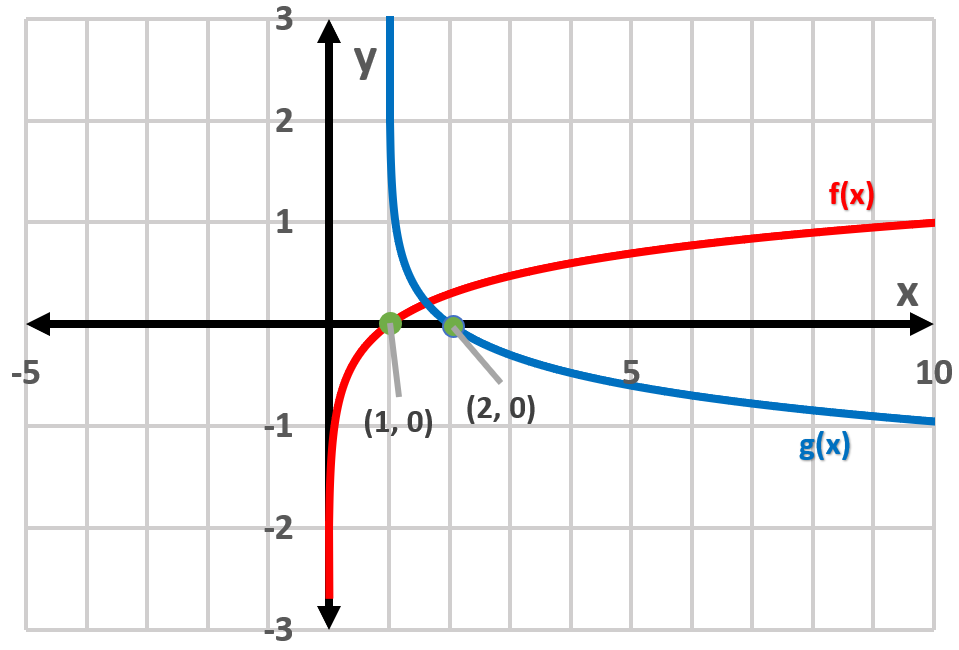
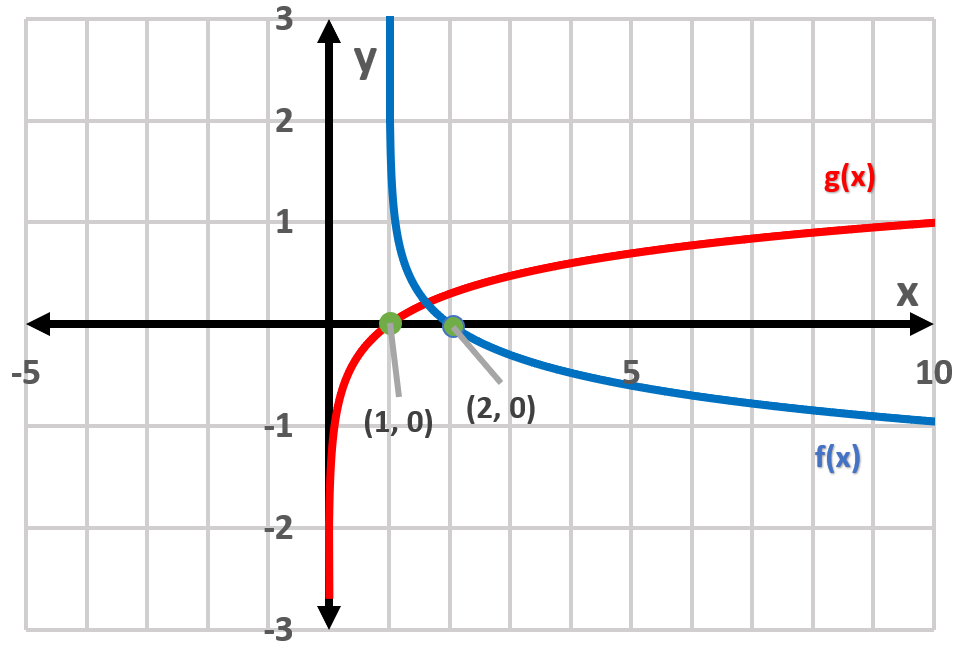
Graph the function f(x) = \log(x). This is a logarithmic function with a vertical asymptote at x = 0 and it passes through the point (1, 0).
Graph the function g(x) = -\log(x+3). This is a transformation of the function f(x) = \log(x).
To obtain the graph of g(x) from f(x), shift the graph of f(x) to the left by 3 units. This means the vertical asymptote of g(x) will be at x = -3.
Reflect the graph of f(x) across the x-axis to account for the negative sign in front of the logarithm. This will invert the graph.
Determine the domain and range of each function. For f(x), the domain is (0, ∞) and the range is (-∞, ∞). For g(x), the domain is (-3, ∞) and the range is (-∞, ∞).
Recommended similar problem, with video answer:
 Verified Solution
This video solution was recommended by our tutors as helpful for the problem above
Video duration:
13mPlay a video:
Was this helpful?
Key Concepts
Here are the essential concepts you must grasp in order to answer the question correctly.
Logarithmic Functions
Logarithmic functions, such as f(x) = log(x), are the inverses of exponential functions. They are defined for positive real numbers and have a vertical asymptote at x = 0. The graph of a logarithmic function increases slowly and approaches the x-axis but never touches it, indicating that the function's range is all real numbers.
Recommended video:
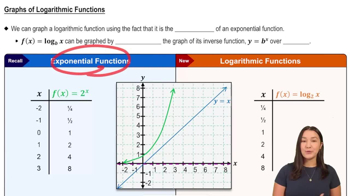
Graphs of Logarithmic Functions
Transformations of Functions
Transformations of functions involve shifting, reflecting, stretching, or compressing the graph of a function. For example, g(x) = -log(x + 3) represents a vertical reflection of f(x) = log(x) and a horizontal shift to the left by 3 units. Understanding these transformations is crucial for accurately graphing related functions.
Recommended video:

Domain & Range of Transformed Functions
Asymptotes
Asymptotes are lines that a graph approaches but never touches. For logarithmic functions, vertical asymptotes occur where the function is undefined, such as at x = 0 for f(x) = log(x). In the case of g(x) = -log(x + 3), the vertical asymptote is at x = -3, indicating the domain of the function is x > -3.
Recommended video:

Introduction to Asymptotes

 7:3m
7:3mWatch next
Master Logarithms Introduction with a bite sized video explanation from Callie
Start learning


