Here are the essential concepts you must grasp in order to answer the question correctly.
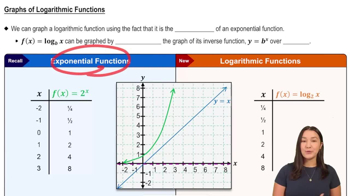
Function Graphing
Graphing a function involves plotting points on a coordinate plane that represent the output values of the function for given input values. Understanding how to interpret the function's equation and its transformations is crucial for accurately representing its behavior visually.
Recommended video:
Graphs of Logarithmic Functions
Transformations of Functions
Transformations refer to changes made to the graph of a function, including shifts, reflections, stretches, and compressions. In the function h(x)=-(x+1)^3, the negative sign indicates a reflection over the x-axis, while the (x+1) indicates a horizontal shift to the left by one unit.
Recommended video:
Domain & Range of Transformed Functions
Cubic Functions
Cubic functions are polynomial functions of degree three, characterized by their general form f(x) = ax^3 + bx^2 + cx + d. They typically exhibit an 'S' shaped curve and can have one or two turning points, which are important for understanding their overall shape and behavior when graphed.
Recommended video:
 Verified Solution


 5:25m
5:25m
