2. Graphs of Equations
Graphs and Coordinates
Problem 80
Textbook Question
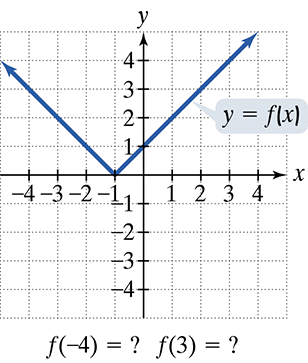
In Exercises 77–92, use the graph to determine a. the function's domain; b.the x-intercepts, if any; and e. the missing function values, indicated by question marks, below each graph. 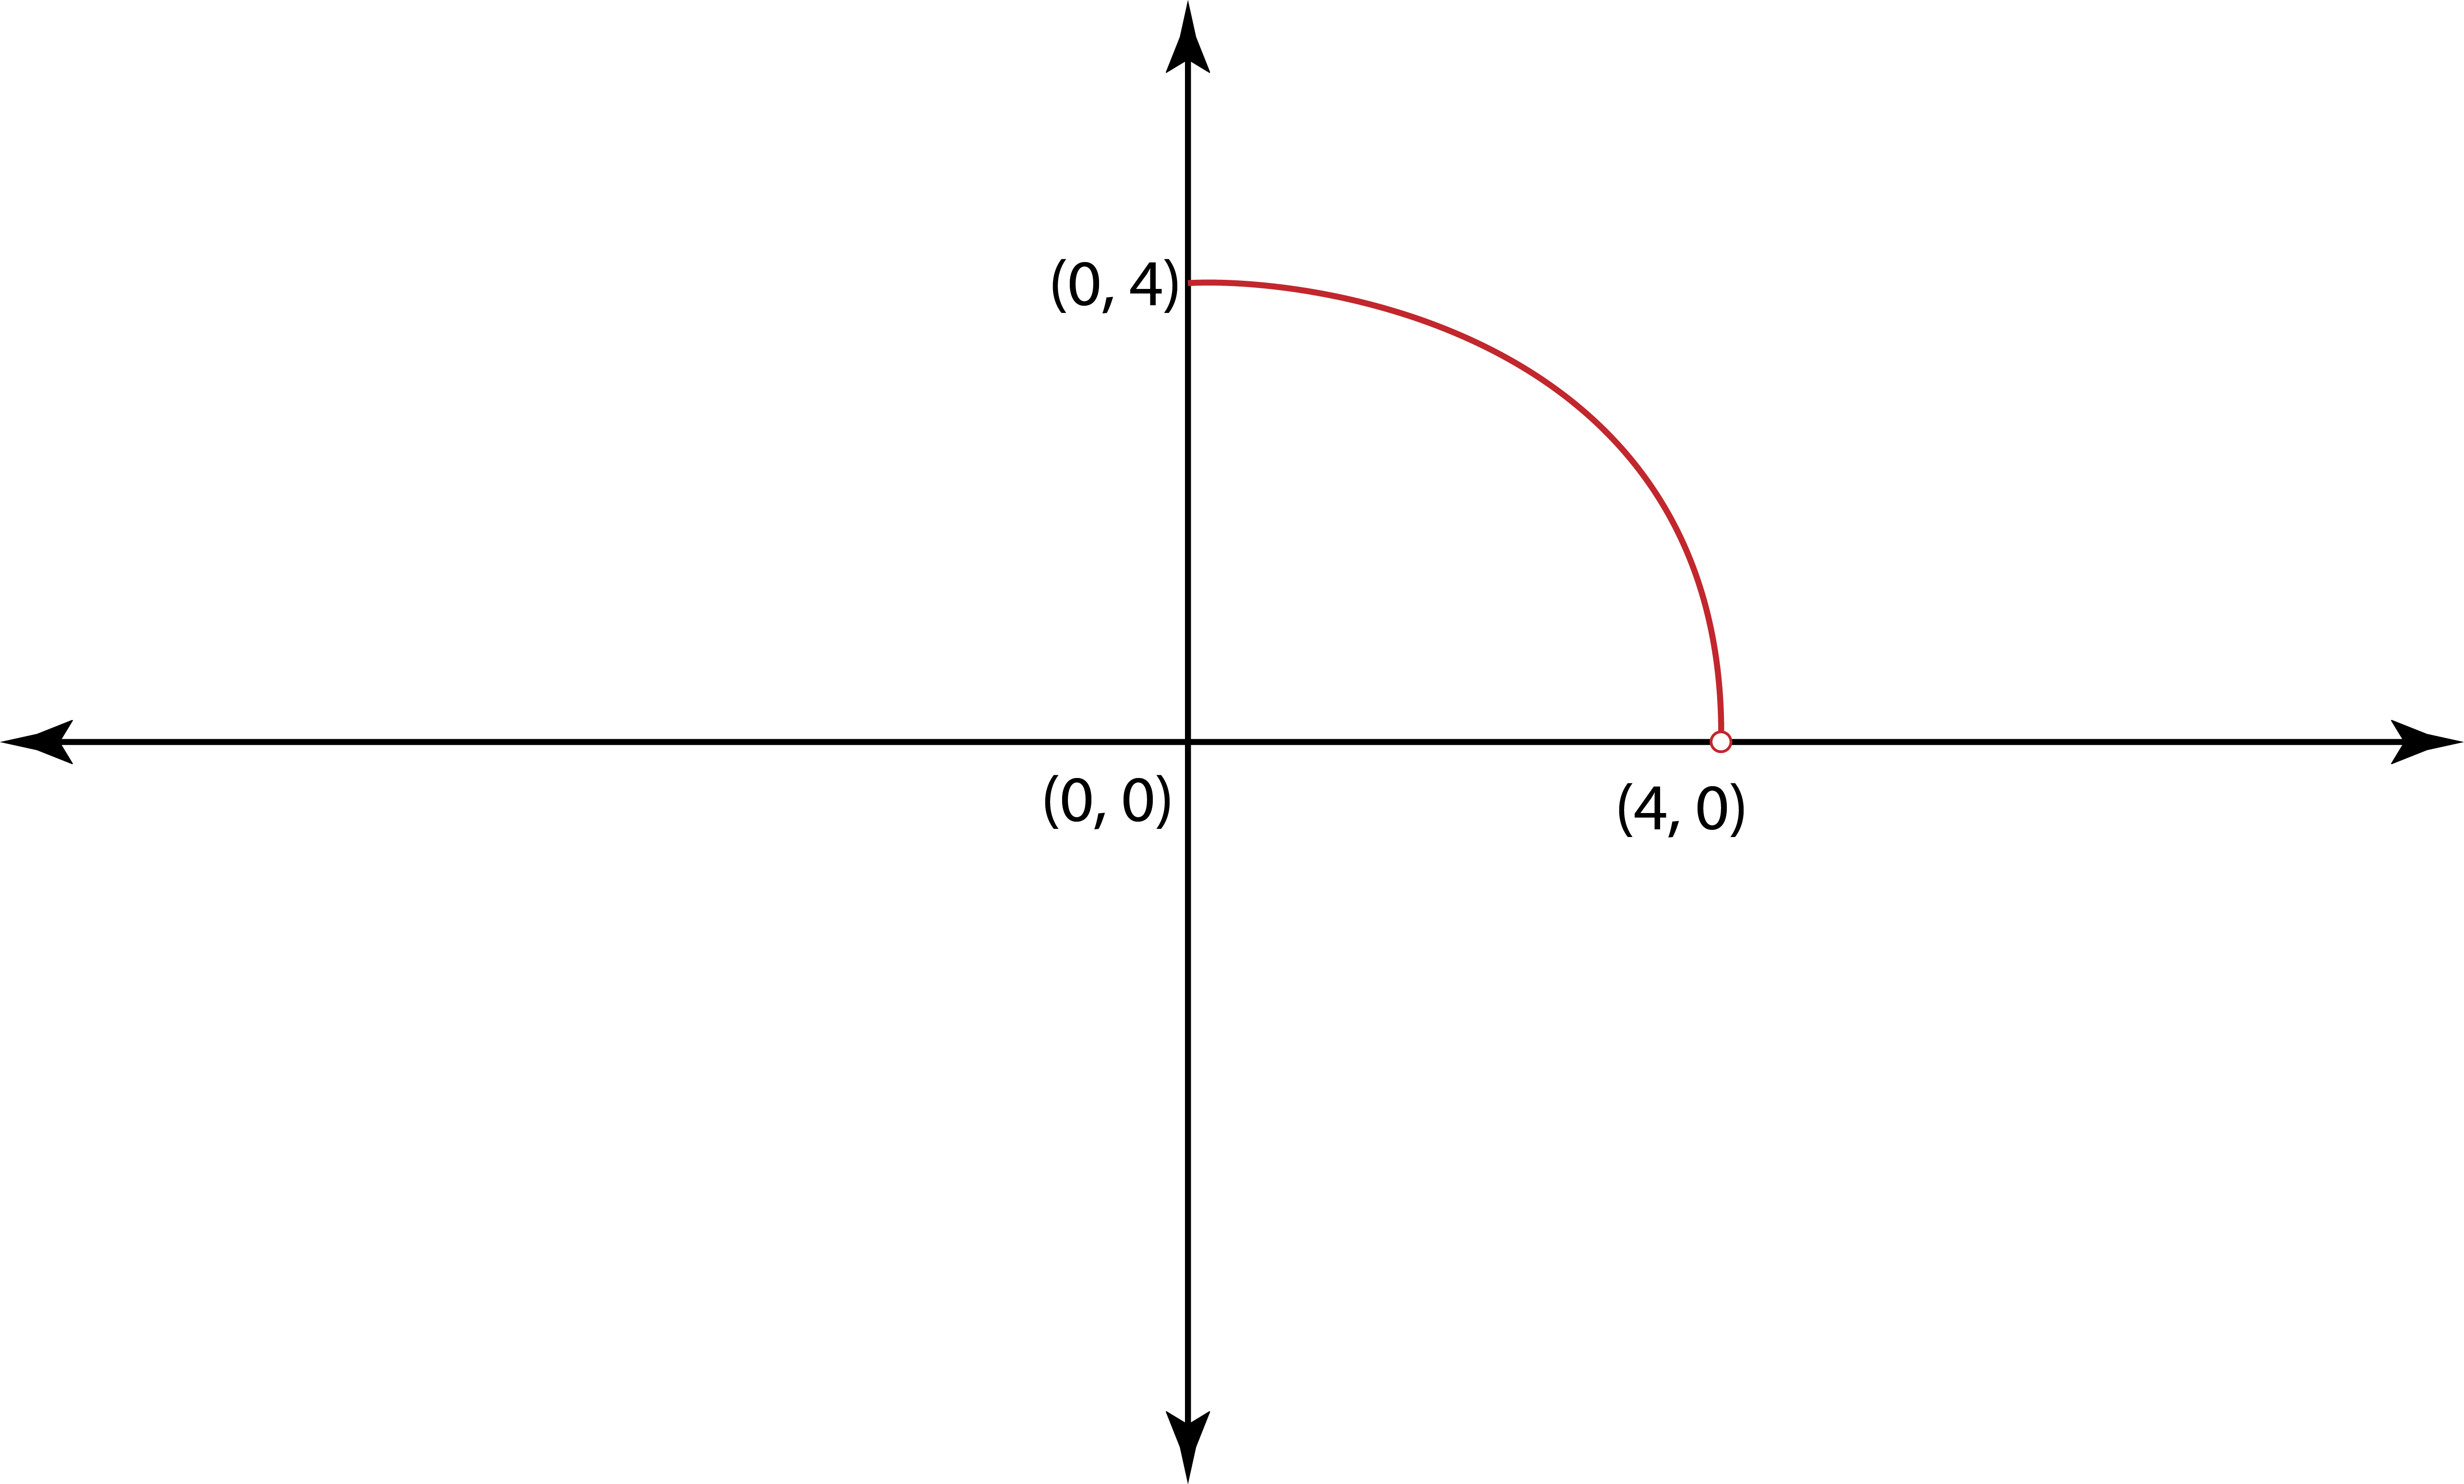
 Verified step by step guidance
1
Step 1: To determine the domain of the function, observe the x-values for which the function is defined. For the first graph, the function is defined from x = 0 to x = 4. For the second graph, the function is defined for all x-values.
Step 2: To find the x-intercepts, look for the points where the graph crosses the x-axis. For the first graph, the x-intercept is at (4, 0). For the second graph, the x-intercept is at (0, 0).
Step 3: To find the missing function values, locate the corresponding y-values for the given x-values on the graph. For the second graph, find the y-values for x = -4 and x = 3.
Step 4: For the second graph, when x = -4, trace vertically to the graph to find the y-value. Similarly, when x = 3, trace vertically to the graph to find the y-value.
Step 5: Summarize the findings: The domain, x-intercepts, and missing function values for each graph.
Recommended similar problem, with video answer:
Verified SolutionThis video solution was recommended by our tutors as helpful for the problem above
Video duration:
3mWas this helpful?

 5:10m
5:10mWatch next
Master Graphs & the Rectangular Coordinate System with a bite sized video explanation from Patrick Ford
Start learningRelated Videos
Related Practice