2. Graphs of Equations
Two-Variable Equations
Problem 22a
Textbook Question
Graph each piecewise-defined function. See Example 2. ƒ(x)={6-x if x≤3, 3 if x>3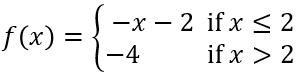
 Verified step by step guidance
1
Identify the two pieces of the piecewise function: f(x) = -x - 2 for x ≤ 2 and f(x) = -4 for x > 2.
Graph the first piece, f(x) = -x - 2, for x ≤ 2. This is a linear function with a slope of -1 and a y-intercept of -2. Plot points for x-values less than or equal to 2 and draw the line.
Graph the second piece, f(x) = -4, for x > 2. This is a horizontal line at y = -4. Plot points for x-values greater than 2 and draw the line.
Ensure the graph of the first piece stops at x = 2 and includes the point (2, -4) with a closed circle, indicating that the value at x = 2 is included in this piece.
Ensure the graph of the second piece starts just after x = 2 with an open circle at (2, -4), indicating that the value at x = 2 is not included in this piece.
Recommended similar problem, with video answer:
Verified SolutionThis video solution was recommended by our tutors as helpful for the problem above
Video duration:
4mWas this helpful?
Key Concepts
Here are the essential concepts you must grasp in order to answer the question correctly.
Piecewise Functions
A piecewise function is defined by multiple sub-functions, each applying to a specific interval of the domain. In this case, the function f(x) has two pieces: one for x less than or equal to 2, and another for x greater than 2. Understanding how to evaluate and graph each piece is crucial for accurately representing the overall function.
Recommended video:

 4:56
4:56Function Composition
Graphing Techniques
Graphing piecewise functions involves plotting each segment of the function according to its defined conditions. For the given function, the first segment, -x - 2, is graphed for x ≤ 2, while the constant value -4 is graphed for x > 2. Knowing how to identify and mark endpoints, including whether they are open or closed, is essential for an accurate graph.
Recommended video:
Guided course
 02:16
02:16Graphs and Coordinates - Example
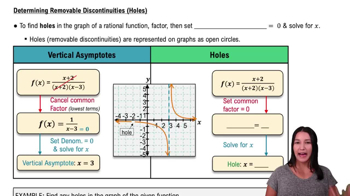
Continuity and Discontinuity
Continuity refers to whether a function is unbroken at a point, while discontinuity indicates a break or jump in the function's graph. In piecewise functions, it is important to check the values at the boundaries, such as x = 2 in this case, to determine if the function is continuous or if there is a jump, which affects the overall behavior of the graph.
Recommended video:
 3:34
3:34Determining Removable Discontinuities (Holes)
 5:28m
5:28mWatch next
Master Equations with Two Variables with a bite sized video explanation from Patrick Ford
Start learningRelated Videos
Related Practice