Here are the essential concepts you must grasp in order to answer the question correctly.
Piecewise Functions
A piecewise function is defined by multiple sub-functions, each applying to a specific interval of the domain. In this case, the function f(x) has two pieces: one for x less than or equal to 2, and another for x greater than 2. Understanding how to evaluate and graph each piece is crucial for accurately representing the overall function.
Recommended video:
Graphing Techniques
Graphing piecewise functions involves plotting each segment of the function according to its defined conditions. For the given function, the first segment, -x - 2, is graphed for x ≤ 2, while the constant value -4 is graphed for x > 2. Knowing how to identify and mark endpoints, including whether they are open or closed, is essential for an accurate graph.
Recommended video:
Graphs and Coordinates - Example
Continuity and Discontinuity
Continuity refers to whether a function is unbroken at a point, while discontinuity indicates a break or jump in the function's graph. In piecewise functions, it is important to check the values at the boundaries, such as x = 2 in this case, to determine if the function is continuous or if there is a jump, which affects the overall behavior of the graph.
Recommended video:
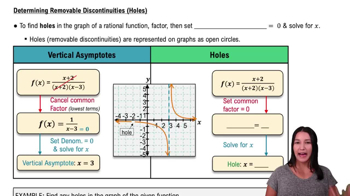
Determining Removable Discontinuities (Holes)

 Verified Solution


 5:28m
5:28m
