2. Graphs of Equations
Lines
Problem 68b
Textbook Question
In Exercises 67–72, use intercepts to graph each equation. 6x-9y-18 = 0
 Verified step by step guidance
1
To find the x-intercept, set \( y = 0 \) in the equation \( 6x - 9y - 18 = 0 \) and solve for \( x \).
To find the y-intercept, set \( x = 0 \) in the equation \( 6x - 9y - 18 = 0 \) and solve for \( y \).
Plot the x-intercept and y-intercept on the coordinate plane.
Draw a straight line through the two intercepts to graph the equation.
Verify the line by checking if another point on the line satisfies the original equation.
Recommended similar problem, with video answer:
Verified SolutionThis video solution was recommended by our tutors as helpful for the problem above
Video duration:
1mWas this helpful?
Key Concepts
Here are the essential concepts you must grasp in order to answer the question correctly.
Intercepts
Intercepts are points where a graph intersects the axes. The x-intercept occurs where the graph crosses the x-axis (y=0), and the y-intercept occurs where it crosses the y-axis (x=0). Finding these points is essential for graphing linear equations, as they provide key coordinates that define the line's position.
Recommended video:
Guided course

 04:08
04:08Graphing Intercepts
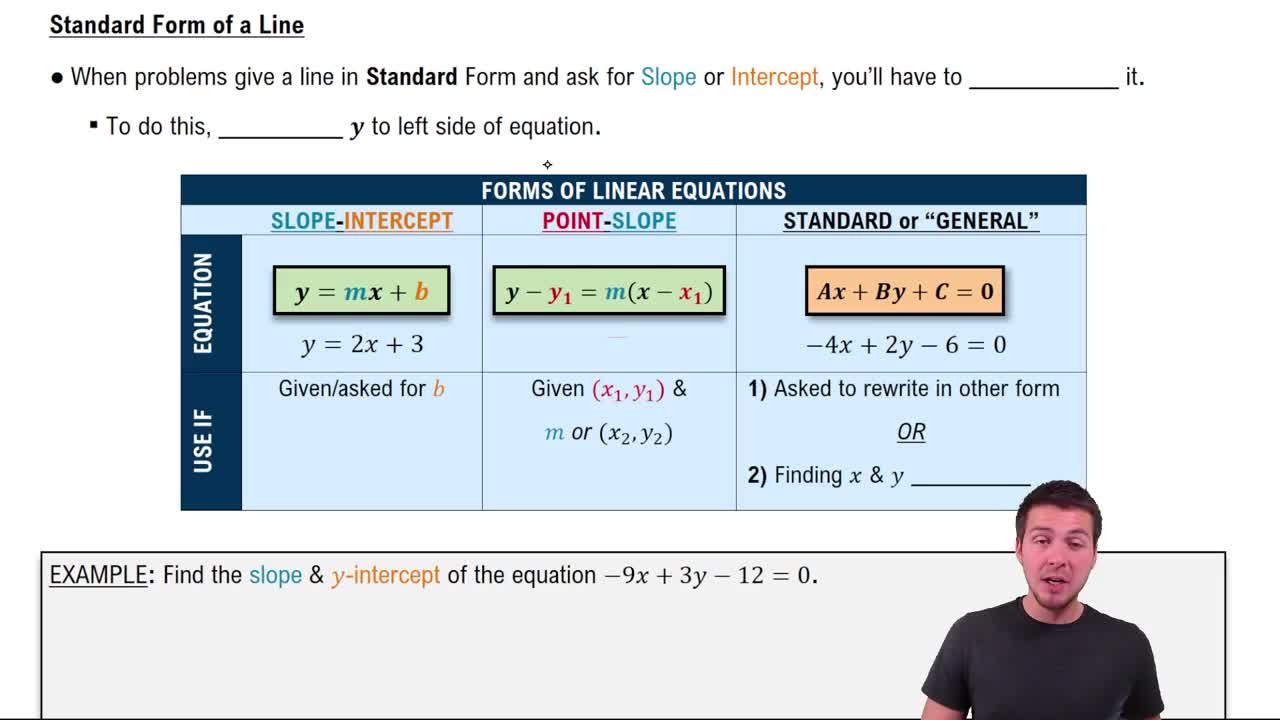
Linear Equations
A linear equation is an equation of the first degree, meaning it can be expressed in the form Ax + By + C = 0, where A, B, and C are constants. The graph of a linear equation is a straight line, and understanding its structure helps in identifying its slope and intercepts, which are crucial for graphing.
Recommended video:
 06:00
06:00Categorizing Linear Equations
Graphing Techniques
Graphing techniques involve methods used to visually represent equations on a coordinate plane. For linear equations, the most common technique is to plot the intercepts and then draw a straight line through these points. This approach simplifies the graphing process and ensures accuracy in representing the equation.
Recommended video:
Guided course
 02:16
02:16Graphs and Coordinates - Example
 6:49m
6:49mWatch next
Master The Slope of a Line with a bite sized video explanation from Patrick Ford
Start learningRelated Videos
Related Practice