Ch. 4 - Exponential and Logarithmic Functions
Blitzer - College Algebra 8th Edition
Blitzer8th EditionCollege AlgebraISBN: 9780136970514Not the one you use?Change textbook
Chapter 5, Problem 17

Graph each function by making a table of coordinates. If applicable, use a graphing utility to confirm your hand-drawn graph. f(x) = (0.6)x

Verified step by step guidance
1
Identify the function given: \(f(x) = (0.6)^x\). This is an exponential function where the base is 0.6, which is between 0 and 1, indicating exponential decay.
Choose a set of x-values to evaluate the function. Typically, select integer values around zero, such as \(x = -2, -1, 0, 1, 2\), to get a good range of points.
Calculate the corresponding y-values by substituting each chosen x-value into the function: \(f(x) = (0.6)^x\). For example, for \(x=1\), compute \(f(1) = (0.6)^1\); for \(x=-1\), compute \(f(-1) = (0.6)^{-1}\), and so on.
Create a table of coordinates with your x-values and their corresponding y-values. This table will help you plot points accurately on the graph.
Plot the points from your table on a coordinate plane and connect them smoothly to reflect the exponential decay shape. Optionally, use a graphing utility to confirm the accuracy of your hand-drawn graph.

Verified video answer for a similar problem:

This video solution was recommended by our tutors as helpful for the problem above.
Video duration:
2m
Was this helpful?

Key Concepts

Here are the essential concepts you must grasp in order to answer the question correctly.

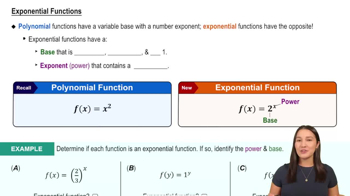
Exponential Functions

An exponential function has the form f(x) = a^x, where the base a is a positive constant. The function grows or decays depending on whether a is greater than or less than 1. In this question, f(x) = (0.6)^x represents exponential decay since 0.6 is less than 1.
Recommended video:
6:13
Exponential Functions

Creating a Table of Coordinates

To graph a function by hand, select several x-values and compute their corresponding f(x) values. This creates a set of points (x, f(x)) that can be plotted on the coordinate plane. For f(x) = (0.6)^x, choosing integer x-values helps visualize the decay pattern.
Recommended video:
Guided course
02:16
Graphs and Coordinates - Example

Using Graphing Utilities

Graphing utilities, such as calculators or software, allow you to plot functions quickly and accurately. They help confirm the shape and key features of your hand-drawn graph, ensuring correctness and providing a visual check for exponential behavior.
Recommended video:
5:31
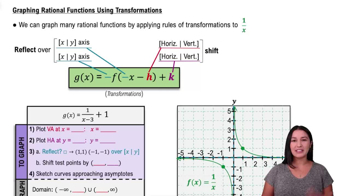
Graphing Rational Functions Using Transformations