6. Exponential & Logarithmic Functions
Introduction to Exponential Functions
Problem 17
Textbook Question
In Exercises 11–18, graph each function by making a table of coordinates. If applicable, use a graphing utility to confirm your hand-drawn graph. f(x) = (0.6)^x
 Verified step by step guidance
1
Step 1: Identify the function type. The function given is an exponential function of the form \( f(x) = a^x \), where \( a = 0.6 \).
Step 2: Create a table of values. Choose a set of x-values, such as -2, -1, 0, 1, and 2, and calculate the corresponding y-values using the function \( f(x) = (0.6)^x \).
Step 3: Calculate the y-values. For each x-value, substitute it into the function to find the y-value. For example, for \( x = 0 \), \( f(0) = (0.6)^0 = 1 \).
Step 4: Plot the points. Use the table of coordinates to plot the points on a graph. For example, plot the point (0, 1) from the previous calculation.
Step 5: Draw the graph. Connect the plotted points with a smooth curve to represent the exponential decay of the function. The graph should approach the x-axis as x increases, but never touch it.
Recommended similar problem, with video answer:
Verified SolutionThis video solution was recommended by our tutors as helpful for the problem above
Video duration:
2mWas this helpful?
Key Concepts
Here are the essential concepts you must grasp in order to answer the question correctly.
Exponential Functions
Exponential functions are mathematical expressions in the form f(x) = a^x, where 'a' is a positive constant. In this case, f(x) = (0.6)^x represents a decreasing exponential function because the base (0.6) is less than 1. Understanding the behavior of exponential functions is crucial for predicting how they grow or decay as 'x' changes.
Recommended video:

 6:13
6:13Exponential Functions
Graphing Functions
Graphing functions involves plotting points on a coordinate plane to visualize the relationship between the input (x) and output (f(x)). For the function f(x) = (0.6)^x, creating a table of coordinates helps identify key points, such as f(0) = 1 and f(1) = 0.6, which are essential for accurately sketching the graph.
Recommended video:
 5:26
5:26Graphs of Logarithmic Functions
Using Graphing Utilities
Graphing utilities, such as graphing calculators or software, provide a powerful way to visualize functions quickly and accurately. They can confirm the hand-drawn graph by generating a precise representation of the function. Utilizing these tools can help students verify their work and understand the function's behavior more deeply.
Recommended video:
 5:31
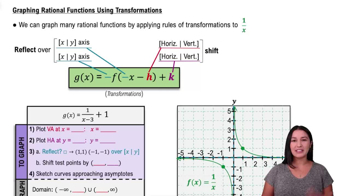
5:31Graphing Rational Functions Using Transformations
 6:13m
6:13mWatch next
Master Exponential Functions with a bite sized video explanation from Callie
Start learningRelated Videos
Related Practice


