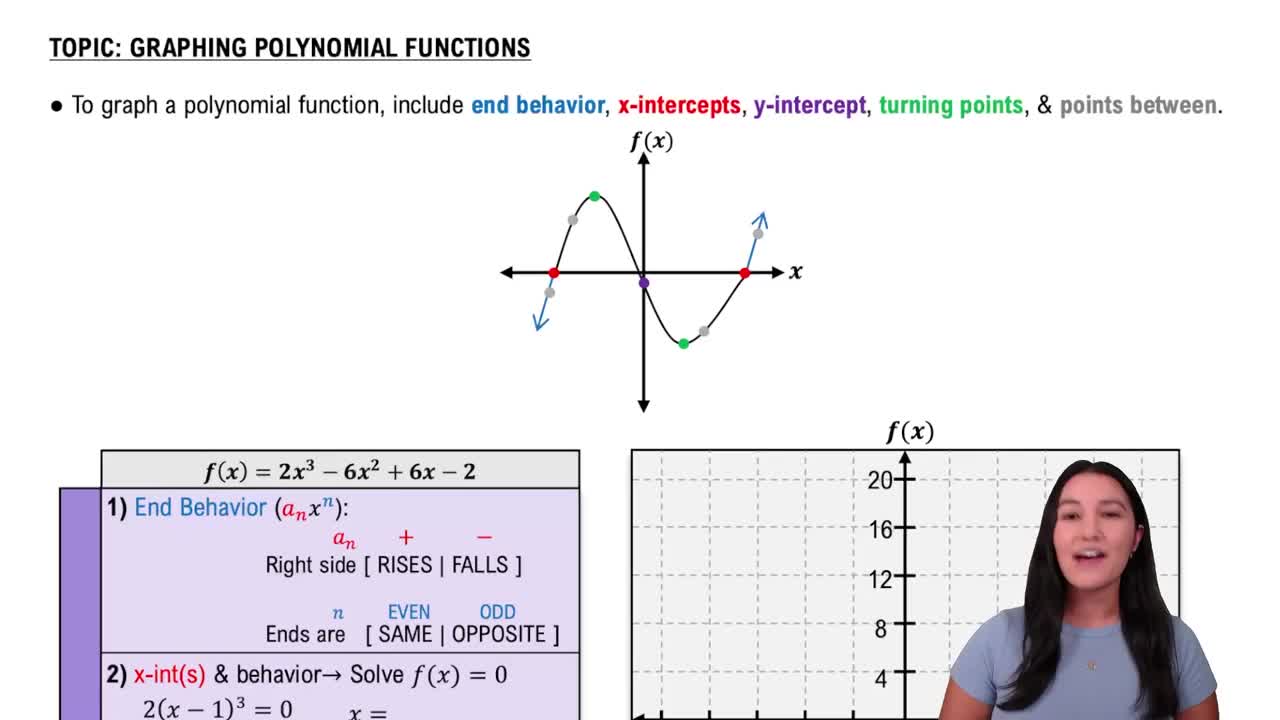
4. Polynomial Functions
Understanding Polynomial Functions
Problem 22a
Textbook Question
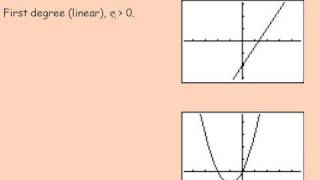
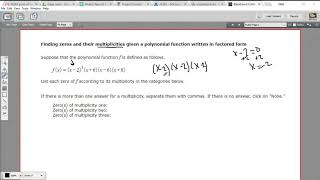
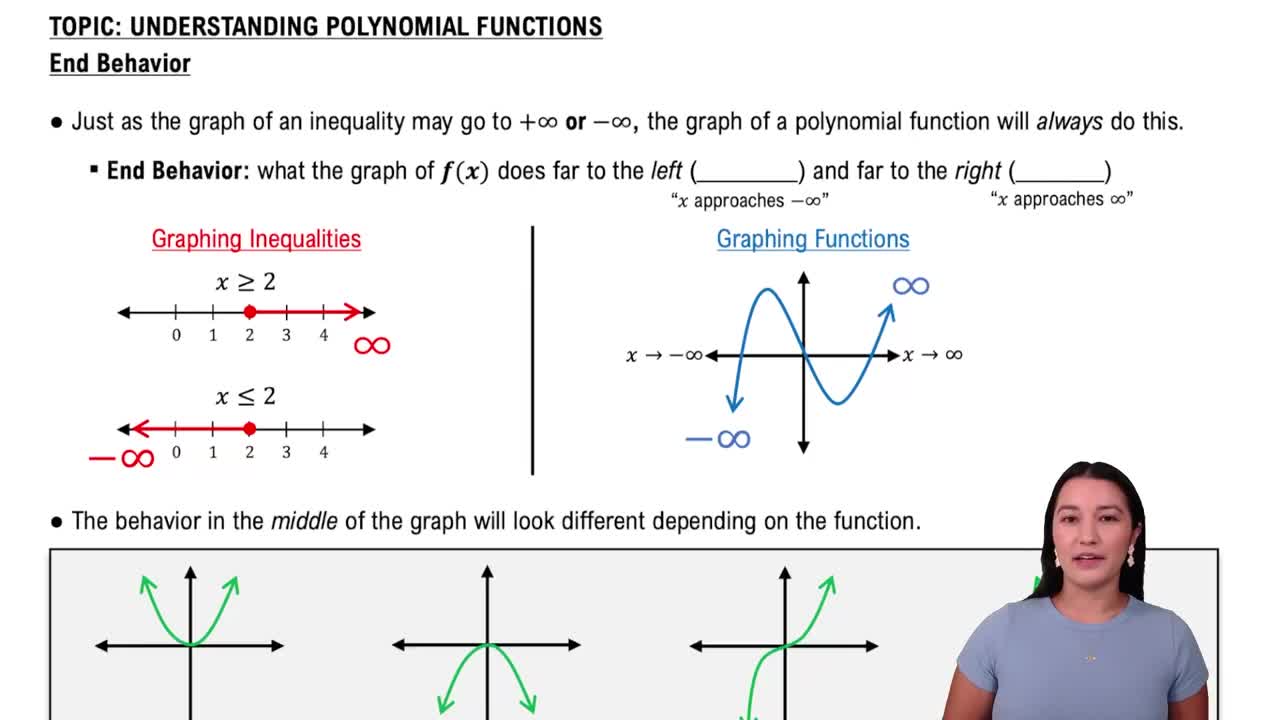
Use an end behavior diagram, , , , or , to describe the end behavior of the graph of each polynomial function. See Example 2. ƒ(x)=-x^3-4x^2+2x-1
 Verified step by step guidance
1
Identify the leading term of the polynomial function, which is the term with the highest power of x. In this case, the leading term is \(-x^3\).
Determine the degree of the polynomial. The degree is the highest power of x, which is 3 in this case, indicating that the polynomial is a cubic function.
Examine the leading coefficient, which is the coefficient of the leading term. Here, the leading coefficient is \(-1\).
Use the degree and the leading coefficient to determine the end behavior of the polynomial. Since the degree is odd and the leading coefficient is negative, the end behavior is such that as \(x \to -\infty\), \(f(x) \to \infty\) and as \(x \to \infty\), \(f(x) \to -\infty\).
Sketch an end behavior diagram to visually represent the behavior of the graph as \(x\) approaches positive and negative infinity, showing the graph rising to the left and falling to the right.
Recommended similar problem, with video answer:
Verified SolutionThis video solution was recommended by our tutors as helpful for the problem above
Video duration:
1mWas this helpful?
Key Concepts
Here are the essential concepts you must grasp in order to answer the question correctly.
End Behavior of Polynomials
The end behavior of a polynomial function describes how the function behaves as the input values (x) approach positive or negative infinity. This behavior is primarily determined by the leading term of the polynomial, which is the term with the highest degree. For example, in the polynomial f(x) = -x^3 - 4x^2 + 2x - 1, the leading term is -x^3, indicating that as x approaches infinity, f(x) will approach negative infinity, and as x approaches negative infinity, f(x) will also approach positive infinity.
Recommended video:
 06:08
06:08End Behavior of Polynomial Functions
Leading Coefficient Test
The leading coefficient test helps predict the end behavior of a polynomial function based on the sign and degree of the leading term. If the leading coefficient is positive and the degree is even, the ends of the graph will rise in both directions. Conversely, if the leading coefficient is negative and the degree is odd, like in the case of f(x) = -x^3, the graph will fall to the right and rise to the left, shaping the overall behavior of the polynomial.
Recommended video:
06:08End Behavior of Polynomial Functions
Graphing Polynomial Functions
Graphing polynomial functions involves plotting points based on the function's values and understanding its shape, which is influenced by its degree and leading coefficient. The graph can exhibit various features such as intercepts, turning points, and asymptotic behavior. For the polynomial f(x) = -x^3 - 4x^2 + 2x - 1, recognizing its end behavior and critical points will aid in sketching an accurate representation of the function.
Recommended video:
 05:25
05:25Graphing Polynomial Functions
 6:04m
6:04mWatch next
Master Introduction to Polynomial Functions with a bite sized video explanation from Callie
Start learningRelated Videos
Related Practice