Recognize that the function given is an exponential function of the form \(f(x) = a^x\), where the base \(a = \frac{1}{3}\) is a positive number less than 1. This means the graph will represent exponential decay.
Create a table of values by choosing several values for \(x\), such as \(-2\), \(-1\), \(0\), \(1\), and \(2\). For each \(x\), calculate \(f(x) = \left(\frac{1}{3}\right)^x\) using the property of exponents.
Recall that for negative exponents, \(a^{-x} = \frac{1}{a^x}\). So, for example, \(f(-1) = \left(\frac{1}{3}\right)^{-1} = 3\), and \(f(-2) = \left(\frac{1}{3}\right)^{-2} = 9\).
Plot the points from your table on the coordinate plane. For example, plot \((0,1)\) since any number to the zero power is 1, and plot the other points accordingly.
Draw a smooth curve through the points, showing the exponential decay behavior: the graph approaches the \(x\)-axis (horizontal asymptote at \(y=0\)) but never touches it, and increases rapidly as \(x\) becomes more negative.
Verified video answer for a similar problem:
This video solution was recommended by our tutors as helpful for the problem above
Video duration:
5m
Play a video:
0 Comments
Key Concepts
Here are the essential concepts you must grasp in order to answer the question correctly.
Exponential Functions
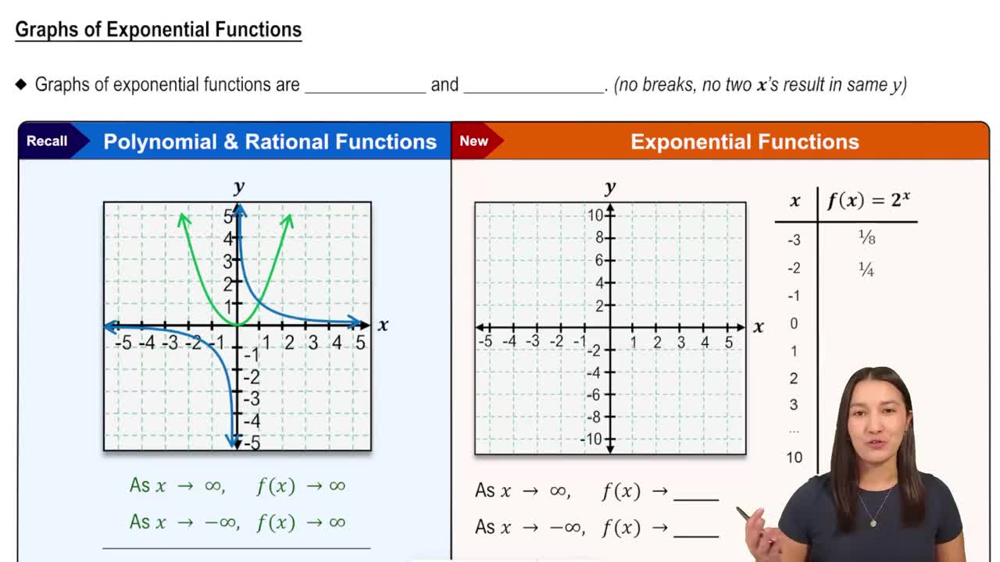
An exponential function has the form f(x) = a^x, where the base a is a positive constant. The function grows or decays depending on whether a is greater than or less than 1. Understanding this helps in predicting the shape and behavior of the graph.
Graphing involves plotting points by substituting values of x into the function and connecting them smoothly. Key features include the y-intercept at (0,1) and the horizontal asymptote, usually the x-axis, which the graph approaches but never touches.
When the base of an exponential function is between 0 and 1, the function represents exponential decay. This means the function decreases as x increases, approaching zero but never becoming negative, which affects the direction and shape of the graph.

 Verified step by step guidance
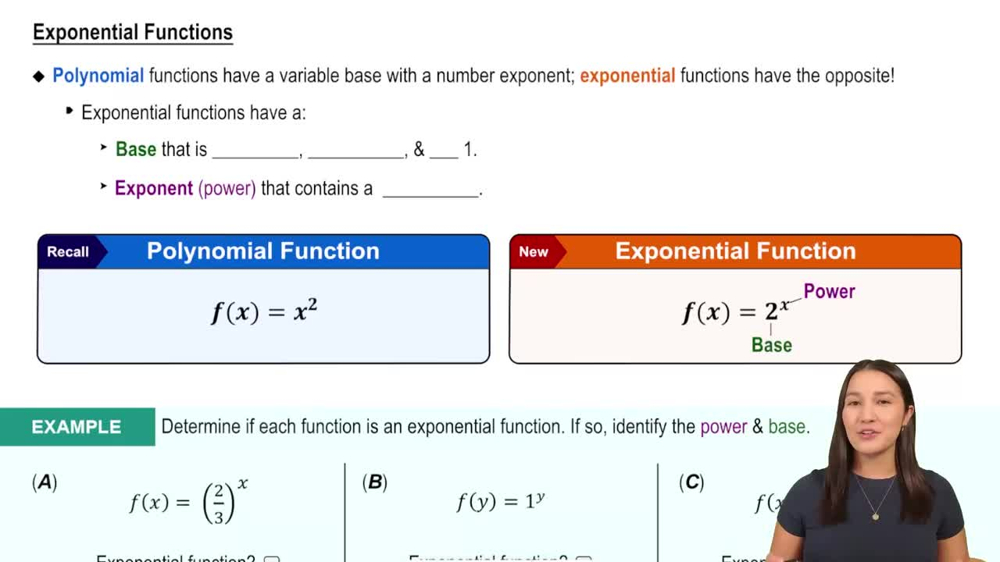
 6:13
6:13