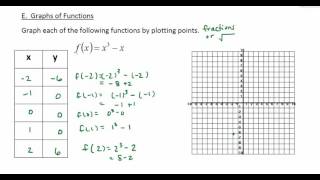
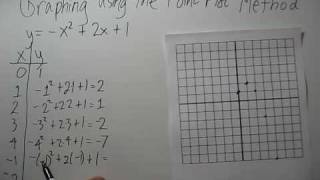
2. Graphs of Equations
Two-Variable Equations
Problem 31b
Textbook Question
In Exercises 31–32, the domain of each piecewise function is (-∞, ∞) (a) Graph each function. (b) Use the graph to determine the function's range.
 Verified step by step guidance
1
<Step 1: Understand the piecewise function. A piecewise function is defined by different expressions depending on the input value. Identify the different pieces and their corresponding domains.>
<Step 2: Graph each piece separately. For each piece, plot the graph over its specified domain. Make sure to consider any open or closed endpoints based on the domain restrictions.>
<Step 3: Combine the graphs of all pieces. Overlay the graphs of each piece to form the complete graph of the piecewise function. Ensure continuity or discontinuity is represented correctly at the boundaries of each piece.>
<Step 4: Analyze the graph to determine the range. The range is the set of all possible output values (y-values) of the function. Look at the graph to see the lowest and highest points it reaches, and any gaps or jumps.>
<Step 5: Write the range in interval notation. Based on the graph, express the range as an interval or a union of intervals, considering any open or closed intervals as indicated by the graph.>
Recommended similar problem, with video answer:
Verified SolutionThis video solution was recommended by our tutors as helpful for the problem above
Video duration:
4mWas this helpful?
Key Concepts
Here are the essential concepts you must grasp in order to answer the question correctly.
Piecewise Functions
A piecewise function is defined by multiple sub-functions, each applying to a specific interval of the domain. Understanding how to interpret and graph these functions is crucial, as each piece can have different rules or equations. This allows for flexibility in modeling real-world scenarios where a single formula may not suffice.
Recommended video:

 4:56
4:56Function Composition
Graphing Functions
Graphing functions involves plotting points on a coordinate plane to visually represent the relationship between the input (x-values) and output (y-values). For piecewise functions, it is essential to accurately depict each segment according to its defined interval, ensuring that transitions between pieces are clear and correctly represented.
Recommended video:
 5:26
5:26Graphs of Logarithmic Functions
Range of a Function
The range of a function is the set of all possible output values (y-values) that the function can produce. To determine the range from a graph, one must observe the vertical extent of the plotted points. For piecewise functions, the range may vary across different segments, requiring careful analysis of each piece to identify the overall output values.
Recommended video:
 4:22
4:22Domain & Range of Transformed Functions
 5:28m
5:28mWatch next
Master Equations with Two Variables with a bite sized video explanation from Patrick Ford
Start learningRelated Videos
Related Practice