Here are the essential concepts you must grasp in order to answer the question correctly.
Inequalities
Inequalities are mathematical expressions that show the relationship between two values when they are not equal. They use symbols such as ≤ (less than or equal to), ≥ (greater than or equal to), < (less than), and > (greater than). Understanding how to interpret and manipulate inequalities is essential for graphing them accurately.
Recommended video:
Quadratic Functions
A quadratic function is a polynomial function of degree two, typically expressed in the form f(x) = ax^2 + bx + c. The graph of a quadratic function is a parabola, which can open upwards or downwards depending on the sign of the coefficient 'a'. In the given inequality, y ≤ x^2 - 1, the function represents a parabola that opens upwards with its vertex at the point (0, -1).
Recommended video:
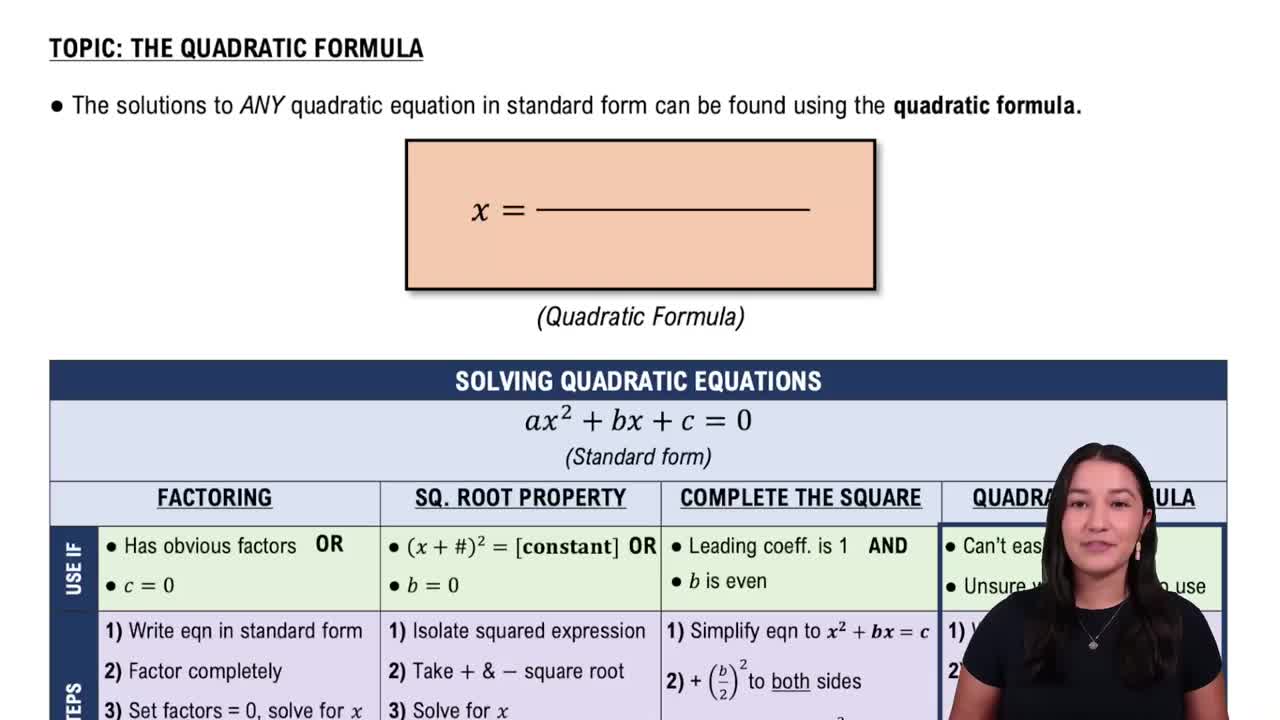
Solving Quadratic Equations Using The Quadratic Formula
Graphing Inequalities
Graphing inequalities involves shading a region of the coordinate plane to represent all the solutions that satisfy the inequality. For the inequality y ≤ x^2 - 1, you would first graph the parabola y = x^2 - 1 and then shade the area below the curve, indicating that all points in that region satisfy the inequality. Understanding how to represent these regions visually is crucial for solving and interpreting inequalities.
Recommended video:
 Verified step by step guidance
 06:07
06:07