Use the graph of y = f(x) to graph each function g. g(x) = -f(x + 1) − 1
Ch. 2 - Functions and Graphs

Chapter 3, Problem 49
Graph each equation in a rectangular coordinate system. y = -2
Verified step by step guidance1
Identify the type of equation given. The equation \(y = -2\) represents a horizontal line because \(y\) is constant for all values of \(x\).
Understand that for any value of \(x\), the value of \(y\) will always be \(-2\). This means the line is parallel to the \(x\)-axis.
To graph the line, plot several points where \(y = -2\). For example, points like \((0, -2)\), \((1, -2)\), and \((-1, -2)\) all lie on the line.
Draw a straight horizontal line through all these points extending across the coordinate plane.
Label the line with its equation \(y = -2\) to clearly indicate which line you have graphed.

Verified video answer for a similar problem:
This video solution was recommended by our tutors as helpful for the problem above.
Video duration:
1mWas this helpful?
Key Concepts
Here are the essential concepts you must grasp in order to answer the question correctly.
Graphing Horizontal Lines
A horizontal line in the coordinate plane has the same y-value for all x-values. The equation y = -2 represents a horizontal line crossing the y-axis at -2, meaning every point on the line has y-coordinate -2 regardless of x.
Recommended video:
Guided course
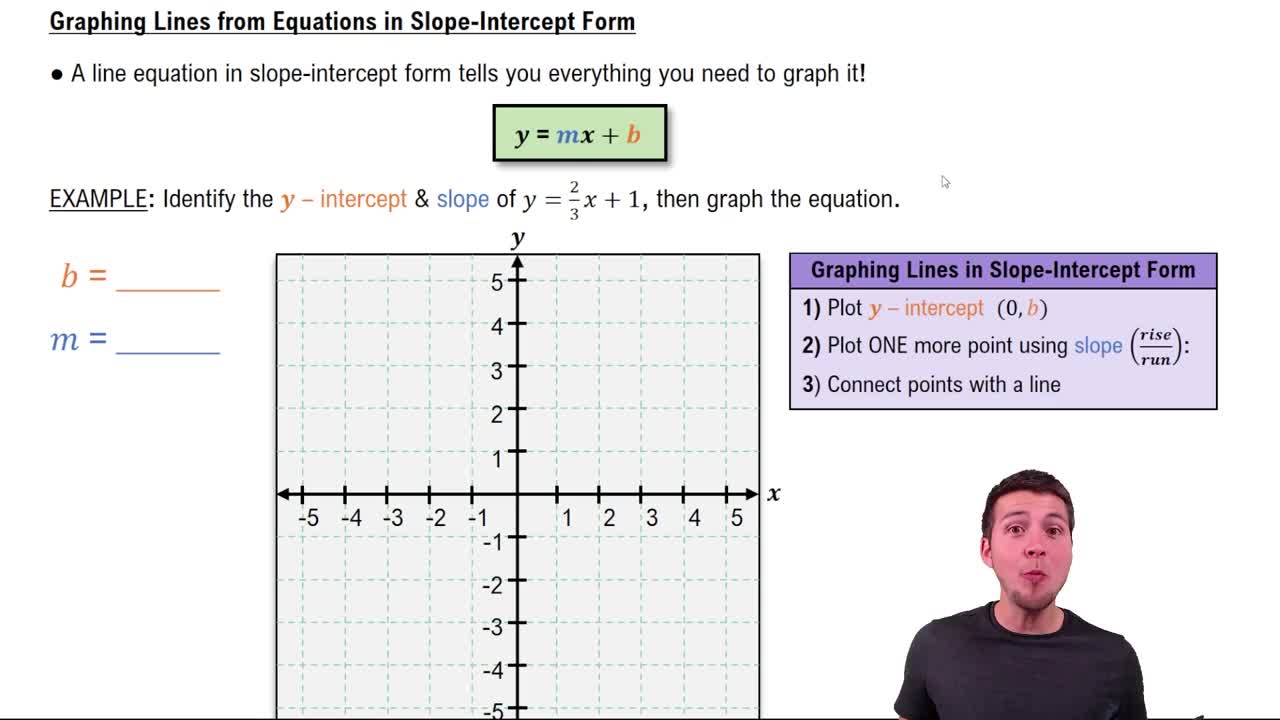
Graphing Lines in Slope-Intercept Form
Rectangular Coordinate System
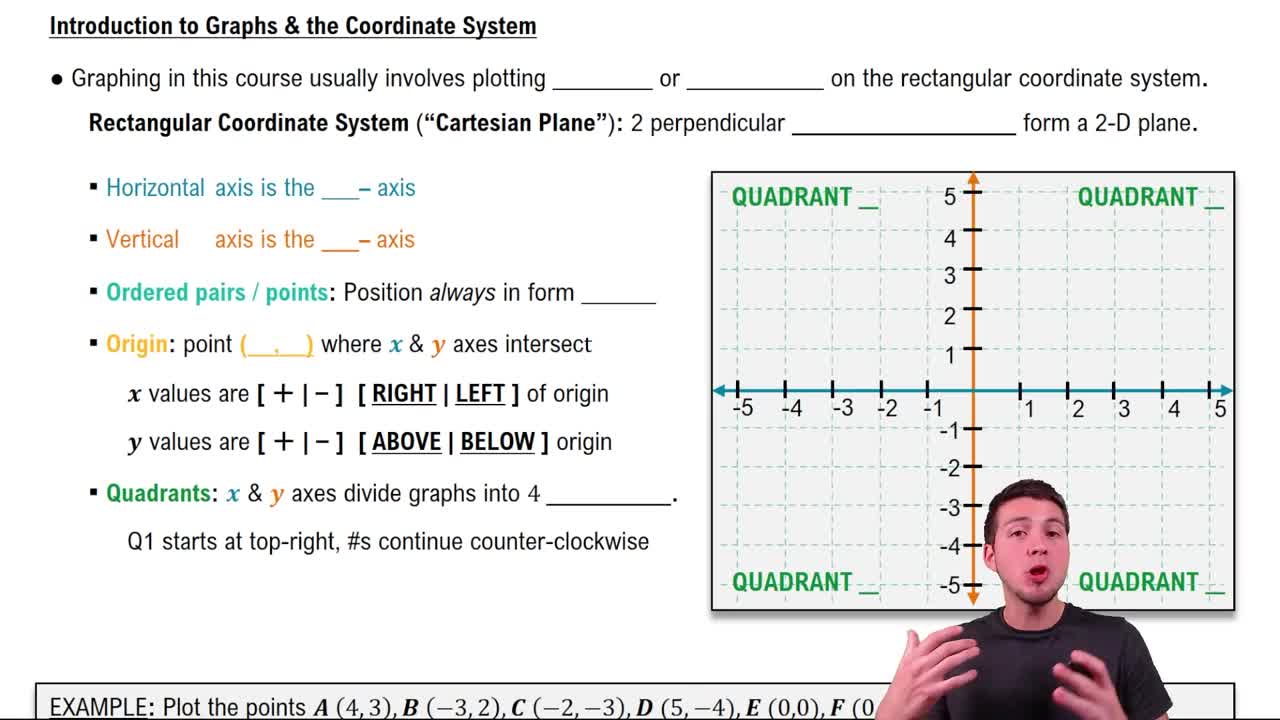
The rectangular coordinate system consists of two perpendicular axes: the x-axis (horizontal) and the y-axis (vertical). Points are located using ordered pairs (x, y), where x is the horizontal position and y is the vertical position.
Recommended video:
Guided course
Graphs & the Rectangular Coordinate System
Plotting Points from an Equation
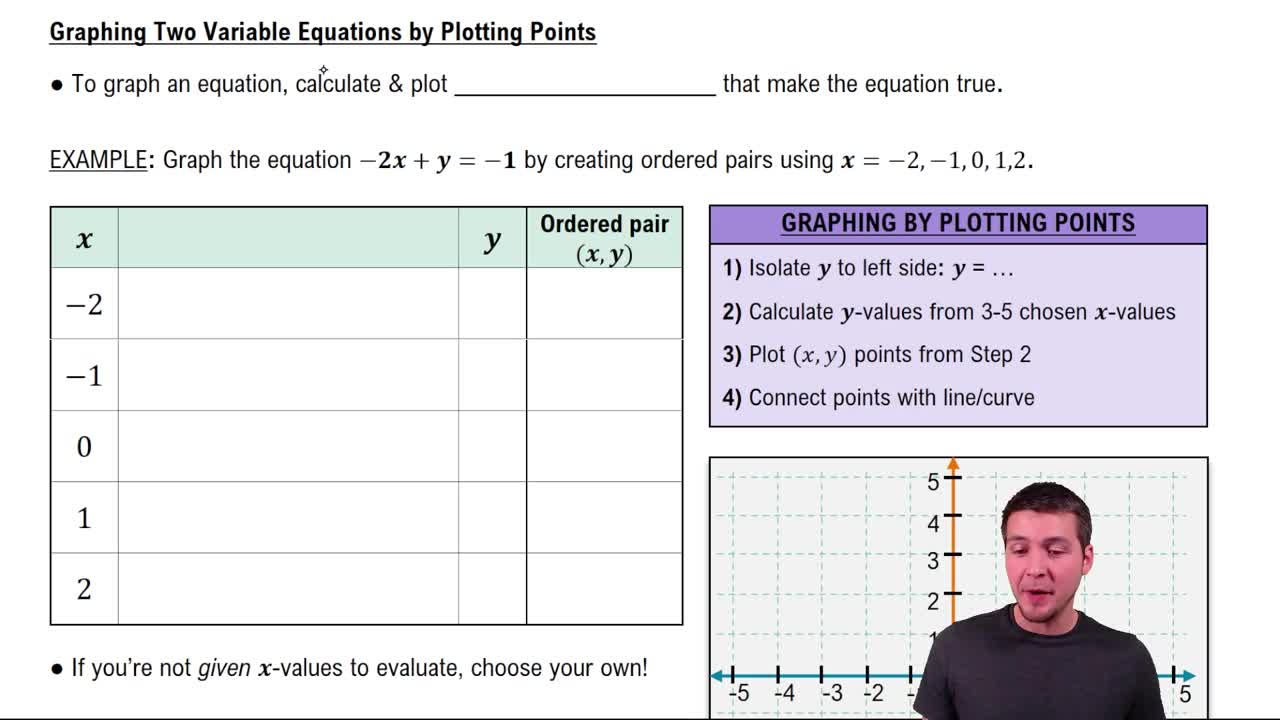
To graph an equation, identify points that satisfy it by substituting values for variables. For y = -2, choose any x-values and plot points with y fixed at -2, then connect these points to form the line.
Recommended video:
Guided course
Graphing Equations of Two Variables by Plotting Points
Related Practice
Textbook Question
692
views
Textbook Question
In Exercises 39-52, a. Find an equation for ƒ¯¹(x). b. Graph ƒ and ƒ¯¹(x) in the same rectangular coordinate system. c. Use interval notation to give the domain and the range off and ƒ¯¹. f(x) = √(x-1)
623
views
Textbook Question
In Exercises 41–52, give the center and radius of the circle described by the equation and graph each equation. Use the graph to identify the relation's domain and range. x² + (y − 1)² = 1
956
views
Textbook Question
In Exercises 46–49, give the slope and y-intercept of each line whose equation is given. Then graph the line. 2x + 3y + 6 = 0
1444
views
Textbook Question
In Exercises 31–50, find ƒ+g, f−g, fg, and f/g. Determine the domain for each function. f(x) = √(x -2), g(x) = √(2-x)
1046
views
Textbook Question
Find ƒ+g, f−g, fg, and f/g. Determine the domain for each function. f(x) = √(x -2), g(x) = √(2-x)
1241
views