3. Functions
Intro to Functions & Their Graphs
Problem 31c
Textbook Question
Determine whether each relation defines a function, and give the domain and range. See Examples 1–4. 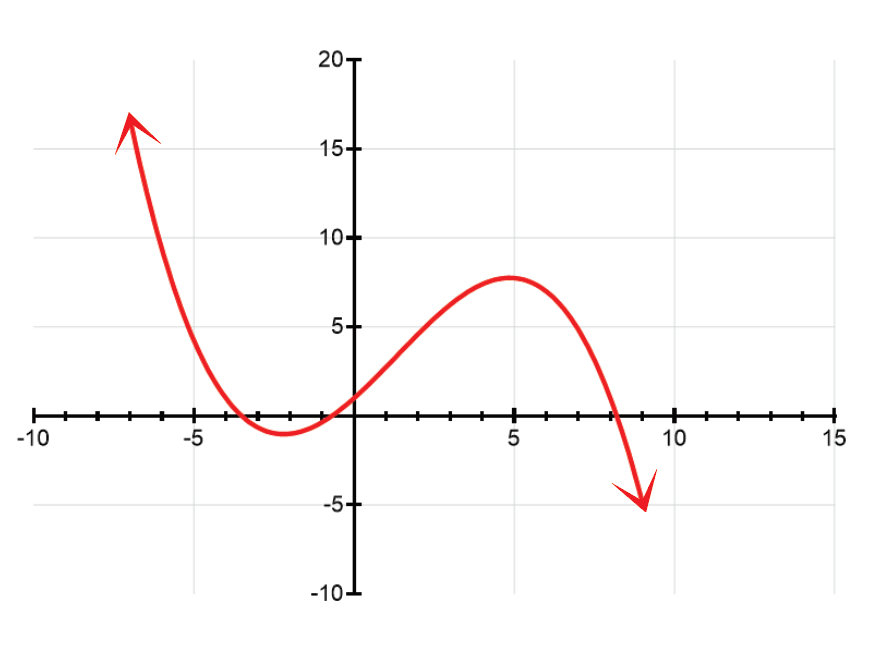
 Verified step by step guidance
1
Step 1: Determine if the relation is a function by using the vertical line test. Draw vertical lines through various points on the graph and check if any vertical line intersects the graph at more than one point.
Step 2: Identify the domain of the function. The domain is the set of all possible x-values for which the function is defined. Look at the x-axis and determine the range of x-values covered by the graph.
Step 3: Identify the range of the function. The range is the set of all possible y-values that the function can take. Look at the y-axis and determine the range of y-values covered by the graph.
Step 4: Summarize the domain and range. Write down the domain and range in interval notation or set notation.
Step 5: Verify your results by reviewing the graph and ensuring that all x-values and y-values within the identified domain and range are included.
Recommended similar problem, with video answer:
Verified SolutionThis video solution was recommended by our tutors as helpful for the problem above
Video duration:
3mWas this helpful?
Key Concepts
Here are the essential concepts you must grasp in order to answer the question correctly.
Function Definition
A function is a relation where each input (or domain value) corresponds to exactly one output (or range value). This means that for any given x-value, there can only be one y-value. To determine if a relation is a function, one can use the vertical line test: if a vertical line intersects the graph at more than one point, the relation is not a function.
Recommended video:

 5:57
5:57Graphs of Common Functions
Domain and Range
The domain of a function is the set of all possible input values (x-values) that the function can accept, while the range is the set of all possible output values (y-values) that the function can produce. Identifying the domain and range involves analyzing the graph to see which x-values and corresponding y-values are included in the function.
Recommended video:
 4:22
4:22Domain & Range of Transformed Functions
Graphical Interpretation
Graphical interpretation involves analyzing the visual representation of a function to understand its behavior. This includes identifying key features such as intercepts, peaks, valleys, and asymptotes. The graph can provide insights into the function's continuity, increasing or decreasing intervals, and overall shape, which are essential for determining the function's characteristics.
Recommended video:
 2:57
2:57Probability of Non-Mutually Exclusive Events Example
 5:2m
5:2mWatch next
Master Relations and Functions with a bite sized video explanation from Nick Kaneko
Start learningRelated Videos
Related Practice


