5. Rational Functions
Graphing Rational Functions
Problem 45
Textbook Question
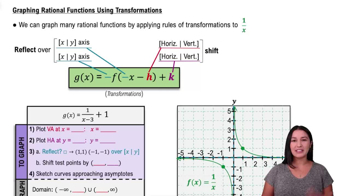
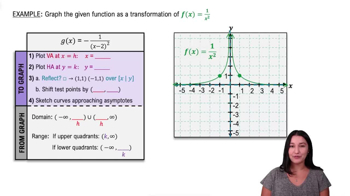
In Exercises 45–56, use transformations of f(x)=1/x or f(x)=1/x^2 to graph each rational function. g(x)=1/(x−1)
 Verified step by step guidance
1
<Step 1: Identify the base function.> The base function here is \( f(x) = \frac{1}{x} \). This is a basic rational function with a vertical asymptote at \( x = 0 \) and a horizontal asymptote at \( y = 0 \).
<Step 2: Determine the transformation.> The given function is \( g(x) = \frac{1}{x-1} \). This represents a horizontal shift of the base function \( f(x) = \frac{1}{x} \) to the right by 1 unit.
<Step 3: Identify the new asymptotes.> Due to the horizontal shift, the vertical asymptote of \( g(x) \) is now at \( x = 1 \). The horizontal asymptote remains at \( y = 0 \) because the transformation does not affect the horizontal asymptote.
<Step 4: Sketch the graph.> Start by sketching the graph of \( f(x) = \frac{1}{x} \), then shift the entire graph to the right by 1 unit to obtain the graph of \( g(x) = \frac{1}{x-1} \).
<Step 5: Verify key points.> Choose a few values of \( x \) around the vertical asymptote (e.g., \( x = 0, 2 \)) to verify the behavior of the graph and ensure it matches the expected transformation.
Recommended similar problem, with video answer:
Verified SolutionThis video solution was recommended by our tutors as helpful for the problem above
Video duration:
5mWas this helpful?
Key Concepts
Here are the essential concepts you must grasp in order to answer the question correctly.
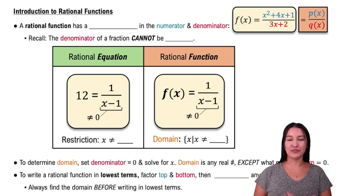
Rational Functions
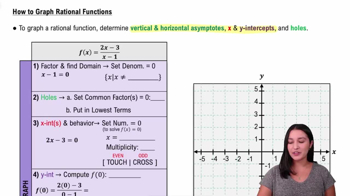
Rational functions are expressions formed by the ratio of two polynomials. They can exhibit unique behaviors such as asymptotes, intercepts, and discontinuities. Understanding the structure of rational functions is essential for analyzing their graphs, particularly how they behave near critical points like zeros and poles.
Recommended video:
 6:04
6:04Intro to Rational Functions
Transformations of Functions
Transformations of functions involve shifting, stretching, compressing, or reflecting the graph of a parent function. For example, the function g(x) = 1/(x-1) represents a horizontal shift of the parent function f(x) = 1/x to the right by 1 unit. Recognizing these transformations helps in accurately sketching the graph of the function.
Recommended video:
 4:22
4:22Domain & Range of Transformed Functions
Asymptotes
Asymptotes are lines that a graph approaches but never touches. For rational functions, vertical asymptotes occur where the denominator is zero, while horizontal asymptotes describe the behavior of the function as x approaches infinity. Identifying these asymptotes is crucial for understanding the overall shape and limits of the graph.
Recommended video:
 6:24
6:24Introduction to Asymptotes
 5:31m
5:31mWatch next
Master Graphing Rational Functions Using Transformations with a bite sized video explanation from Callie
Start learningRelated Videos
Related Practice