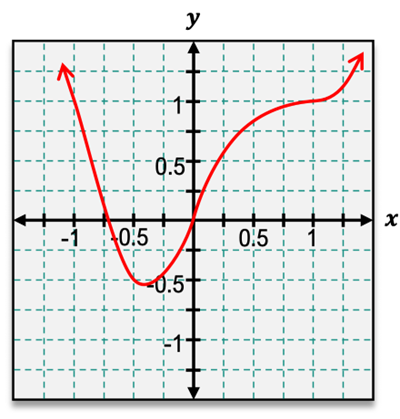
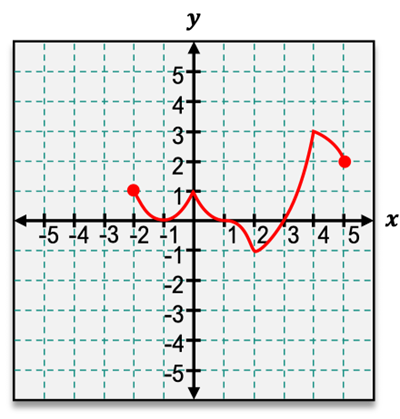
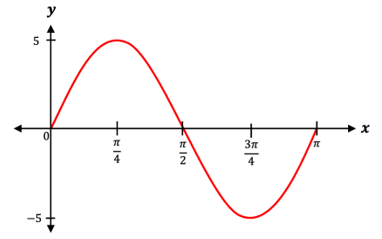
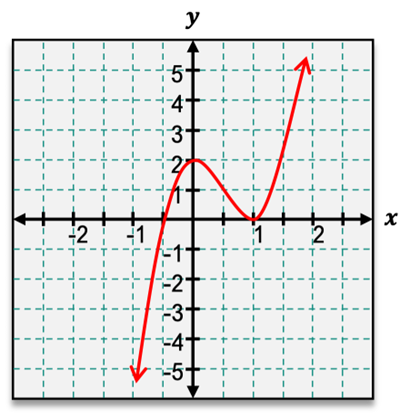
In previous videos, we learned how the sign of the first derivative of a function shows us whether that function is increasing or decreasing. But what if we took that one step further and actually took a look at the sign of the second derivative? What does that tell us about a function? Well, the sign of the second derivative of a function actually shows us what's called a function's concavity. Now that word "concavity" may sound a bit intimidating, but all concavity is is just the shape of a graph and how it curves.
Now here, I'm going to walk you through exactly what it means and what it looks like on a graph for a function to be concave up or concave down and also show you how exactly that relates to the sign of the second derivative. So let's go ahead and get started here. Now let's come right down here to the left side of this graph. We can see that our graph is curving upward. It looks sort of like the smile of a smiley face.
Now whenever we see this shape on a graph, we say that this function is concave up. And when a function is concave up, that corresponds to the second derivative of that function being positive. Now looking over here at the right side of this graph, we can see that it starts to curve downwards. It looks sort of like a frowning face. Now whenever this happens, our function here is concave down, which corresponds to a second derivative of our function being negative.
Now visually, this can be a helpful tool in remembering what it looks like for a function to be concave up or concave down on a graph. Concave up looks like a smile. Concave down looks like a frown. Now even though it's really important to be able to visually recognize the concavity of a function, it's also important to recognize why the second derivative affects that. So let's dive into this more.
Now we know that the first derivative of a function is the rate of change of that function, its slope. So the second derivative of a function is then the rate of change of that first derivative, which we can also think of as being the rate of change of the slope of our function. So let's actually come down back here to this left side of our graph and take a closer look at what's going on with the slope. We can do that by drawing some tangent lines. Now here, we can see that our tangent line starts out with a steep negative slope.
Then it becomes a little bit less steep, still negative, until it becomes 0. So we can see that it starts out very negative and then becomes 0. So it increases from being negative to now being 0. It continues increasing on the other side here, getting pretty steep in the positive direction. So on this whole side that our function is concave up, that slope is increasing.
Now because it's increasing, that means it has a positive rate of change. So that's the exact same thing as saying that it has a positive second derivative. Now, coming back over here to the right side of our function, if we draw some tangent lines over here, we can see that that slope starts out positive, then decreases to 0, continues decreasing as it gets a negative slope. So because this slope is decreasing, it has a negative rate of change and a negative second derivative. So concavity is just how the slope is changing.
That's why it's affected by the sign of our second derivative. Now, having drawn all of these tangent lines on our function here, we can see that on the side where our function is concave up, all of our tangent lines sit underneath the curve. Then where our function is concave down, these tangent lines sit above the curve. This can also be a helpful visual cue in identifying the concavity when given a graph. Now at this point in the middle of this graph, we can see that this is where our function changes concavity from being concave up to now being concave down.
So this is where our function changes concavity, and this point has a special name. It is referred to as an inflection point. Now at an inflection point where our function changes concavity, our second derivative will either be equal to 0 or not exist at all. So similar to a critical point where our first derivative was either equal to 0 or did not exist, this is the same idea, but here for our second derivative, this is an inflection point. So now that we've walked through concavity in detail, let's actually apply this to an example here.
So let's work through this bottom example together. We want to identify where this function is concave up or concave down and also state any points of inflection. Now whenever doing this on a graph, it can be helpful to just go ahead and look at our graph from left to right. So we're gonna start on this far left side here from negative infinity. Now immediately looking at this graph, I can see that it's curving downwards.
Remember, concave down looks like a frown. So my function here starts off being concave down from negative infinity. Now where does this interval end? Where does it stop being concave down? Well, continuing on from left to right here, this is where it can be helpful to go ahead and draw some tangent lines.
I can see that our tangent lines are above our curve where it is concave down, then they transition to now being underneath our curve. So this is a cue to me that my function is changing concavity here. So I can see that at this point x equals a negative one, my function changes concavity. That's the end of that interval of being concave down. Now because I know that that's where my function changes concavity, I know that this is a point of inflection, x equals negative one.
So continuing on our function here, at that point negative one begins our next interval where our function is concave up because it looks like a smile there. So our function is in concave up starting from negative one and continuing from left to right here. Where does it stop being concave up? Again, it can be helpful here to go ahead and draw our tangent lines and pay attention to what's going on with the slope here. We can see that these tangent lines transition from being underneath our curve to now being on top right here at x equals 2.
So this indicates to me yet another point of inflection, x equals 2, and the end of that interval of my function at being concave up. Then it starts to curve downwards again, concave down, looks like a frown, and that continues on to infinity. So my function is again concave down from 2 on to infinity. So here we have all of our intervals of concavity along with our inflection points. In the next couple of videos, we're going to continue learning more about concavity and getting more practice.
I'll see you there.
