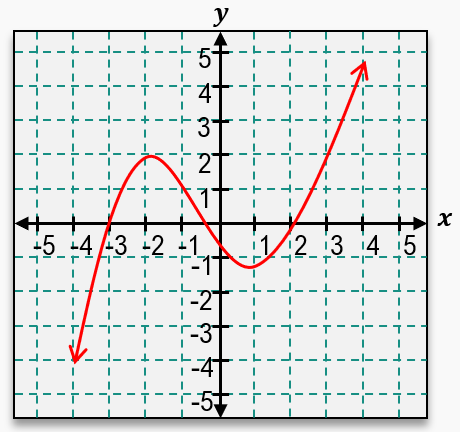
One of the things we've spent a lot of time talking about in previous courses and videos is the concept of functions and how various functions are going to give you different looking graphs. But one of the things that becomes really tricky is trying to remember all the various properties of functions, and that's what we're going to be talking about in this video. You're going to want to know these well because you're going to see all of these properties at some point in this course. So without further ado, let's get right into things. Now the first thing we're going to take a look at is what is called the maximum value of a function.
Now the maximum value is simply asking for where the highest point of your function is. And looking at this curve that I have, I can clearly see that the highest point occurs right there. So what this tells me is that for this value of x, we're going to get the highest output or y value that corresponds to that point. So what I can say is that this is going to be where our function is greater than all of the rest of these values for all x values. So this is telling me that this x value will give me the highest y value or the highest output for our function.
Now another thing we need to be familiar with is the minimum value. And the minimum is, in essence, asking you for the opposite of the maximum. So the maximum is the highest point, whereas the minimum is the lowest point. We can see that the lowest point occurs right here. Now what this means is that f(c), some point x we have here, is going to be less than or equal to the function for all x values.
So this x value is going to give us the lowest possible output when we put it into our function. So in essence, for both of these, you could think that this would be c right here for this function, and then this would be c right here for that function because we're looking at either the lowest value for minimum or the highest value for maximum. Now something else we need to be familiar with is the concept of functions that are increasing or decreasing. And there's a simple way that I like to think about this. There's an analogy I like to use.
What you can imagine is that there is a person, a little person, walking on our function, and they're going from left to right. Now notice if this person were walking from left to right, they would be traveling up the side of this function. So because this person is continuously going up, that's the trend of this function, we would say that this whole graph is going up, which means that we're dealing with an increasing function. Now, likewise, you can imagine we have the same person on a different graph over here, but this time, notice that the general trend is that this person is going down. Because the general trend is that this graph and this function is going down, that means we are now dealing with a decreasing function.
But what would happen if we had a situation where we had a person on our graph here, and they walked from left to right, and nothing seemed to really happen? They didn't really go up, and they didn't really go down. They kinda just would keep going straight. Well, this is a case where we can say our graph is flat. Now whenever we have a flat graph, that means that we're dealing with a constant function.
Now the reason we call this a constant function is because you can imagine we just have one constant output. So notice here for this y value, let's pretend that this y value here is 2. If this y value was output 2, notice it's constantly going to be 2 at every point. We get a constant output, so for every possible input for x, we're going to get an output of 2 every single time that's not going to change. So this is why we call this a constant function.
Now another concept that's important to understand is the possible symmetry of a function. One of the symmetries that we'll see is something referred to as symmetry on the y-axis, and this would be an example of a function that's symmetric on the y-axis. And the reason why is because you can imagine taking this function and folding it like a piece of paper, where you crease it on the y-axis and fold it. Doing that would give you a symmetric graph that you would see for both sides of this function, so that's why we say it's symmetric on the y-axis. And whenever this happens, we say that we're dealing with an even function and that our function, if we input a negative x value, is going to give us the function output, the same thing as putting a positive x value in for our function.
And if you're not sure what this means, well, let me explain. So let's say we're looking at this point right here. And let's say that this x value is negative 3, and then the output at this point is 2. Well, if we go ahead and take positive 3 and put it into our function, so the positive x value, we're also going to get an output of 2. So notice both the negative x value and the positive x value both give you the same output as a y value.


